Within each report, you are able to customize your experience and engagement with the data by leveraging the following functionality:
- Export the data into an excel file
- Create automated Scheduled Reports and Alerts that are emailed or texted to you
- Create Dashboard Widgets and Counters to add to your dashboards for a high level business snapshot
- Save As custom reports with the filters and metrics that are most important to your business, so that you don't need to recreate the wheel each time you login.
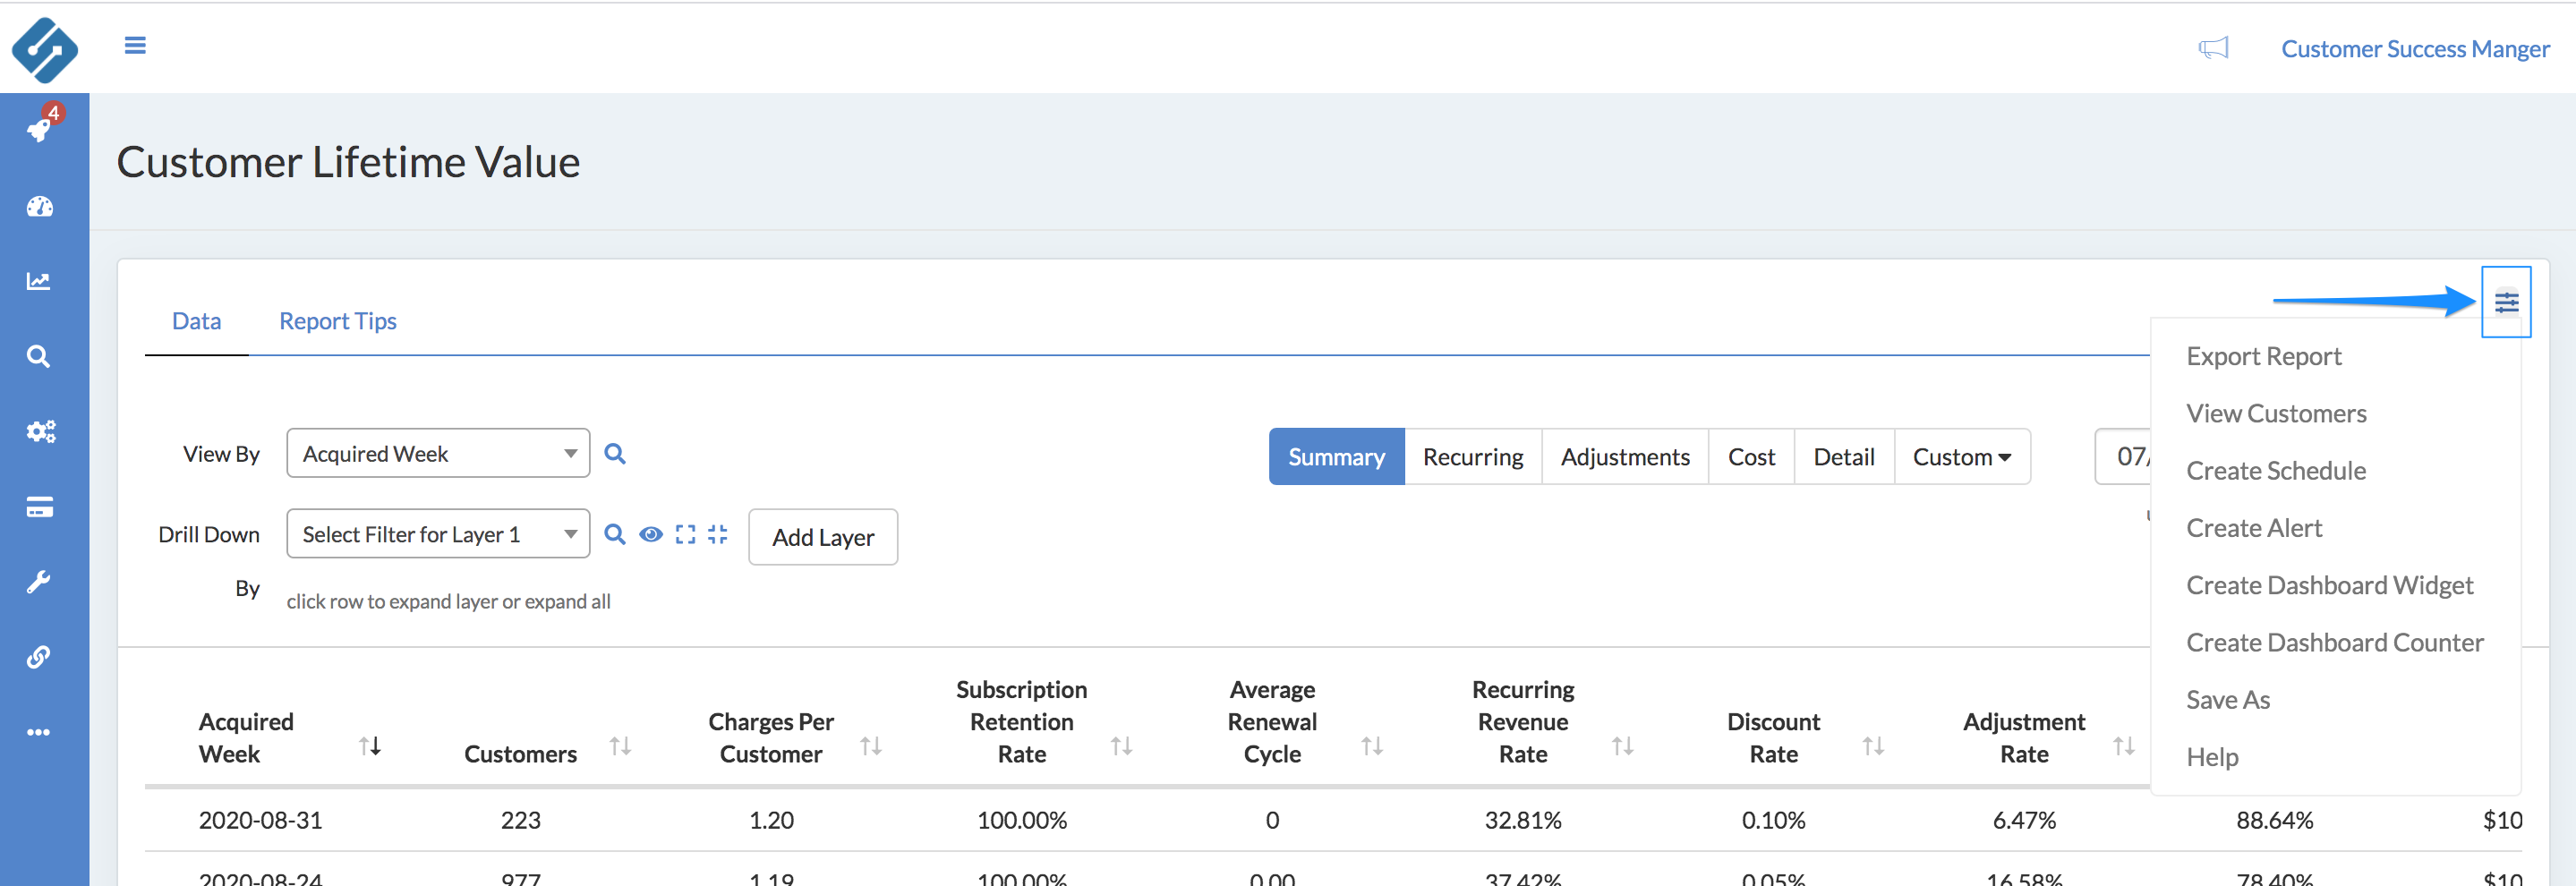
All of the configuration capabilities are under the menu icon in the right corner contained on widgets, counters, dashboards, and reports:

Export Report
This feature can be used to export the data within the report to a CSV file. Some users may need this functionality if they want to assemble their own data files or keep a static snapshot of data at a specific time.
- Export Report will export the report in a data table view with all of the filters displayed as columns. For this view, you do not need to expand the desired rows; all of the filter level data will be included in the export.
Use Case Example
A business has 3 Fulfillment Centers shipping their product. Fulfillment Center B has run out of Item C. The Logistics Manager wants to show all customers from Connection A under Fulfillment Center B that were shipped Item C and have not had their product delivered. In a few easy steps, Sublytics can output this exact list and the business can alert these customers of a delay
View Customers
This feature can be used to export to a CSV file of the customer data for the customers in the current report view.
Create Schedule
A schedule is an email or text message that can deliver the reporting information on to a user or many users on whatever frequency configured. This is useful for team reports, weekly meetings set where a report will generate prior to the meeting, a list of customers for Customer Service to reach out to on a set basis. Learn how to create a scheduled report here.
Create an Alert
An alert is an email or text message that is triggered based on a logic condition being met within the data. For example, an email sent to a customer service manager anytime a package shows a "Return to Sender" delivery status. Or alert me when this specific metric is below x% during y timeframe. Setting alerts allows the business to get in front of issues in a proactive and swift manner. Alerts are one of the most beneficial aspects of Sublytics that is underused.
There are no limitations on what metrics or filters an alert can be set on. Learn more about alerts here.
Create a Dashboard Widget
A Widget is a visual and/or graphical representation of single or multiple data metrics that can be assigned to a Dashboard, scheduled as an email/text or both.
Create a Dashboard Counter
A Counter is a visual representation of a single data metric that can be assigned to a Dashboard. Example, todays revenue $36,486.23
For more details on setting up a Dashboard, see here.
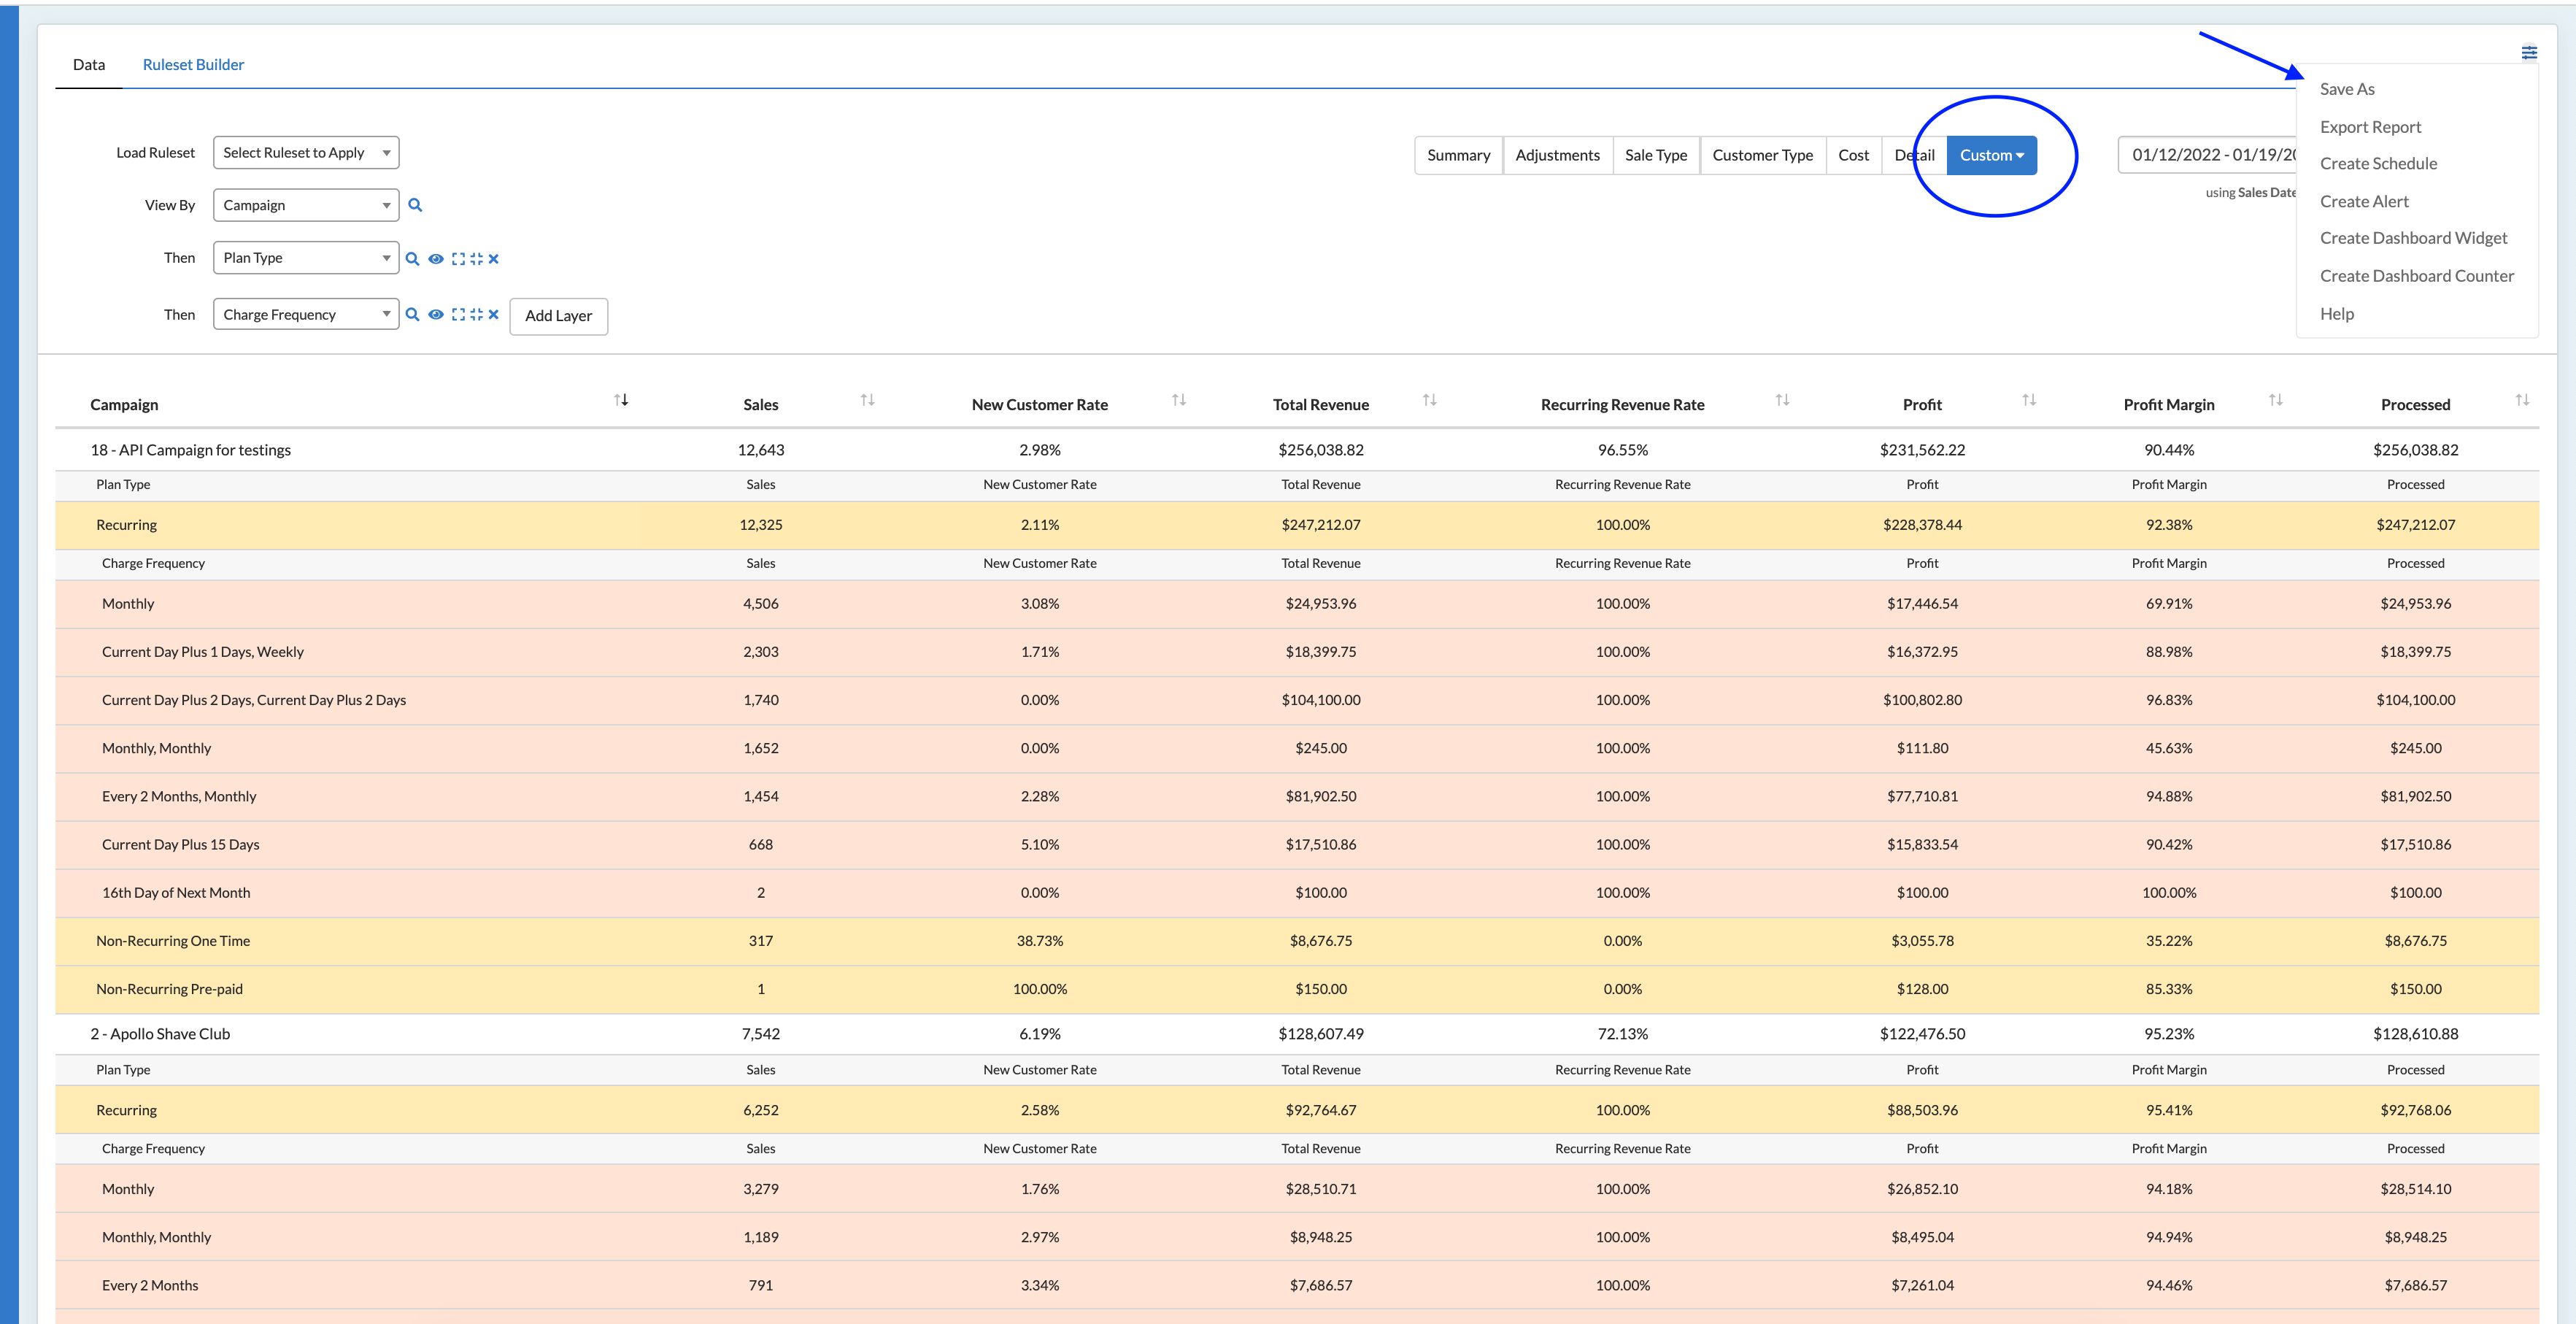
Save As
If you have modified the report and want to have future access to it, then you will want to save it using the Save As feature. Once you save a report, it is considered a "Custom Report."
Saving custom reports is recommended when updating the default summary view anytime you go into the report. Saving that view so it is the new default view, using the filters and timeframe allows you to spend time analyzing the data instead of organizing the data.
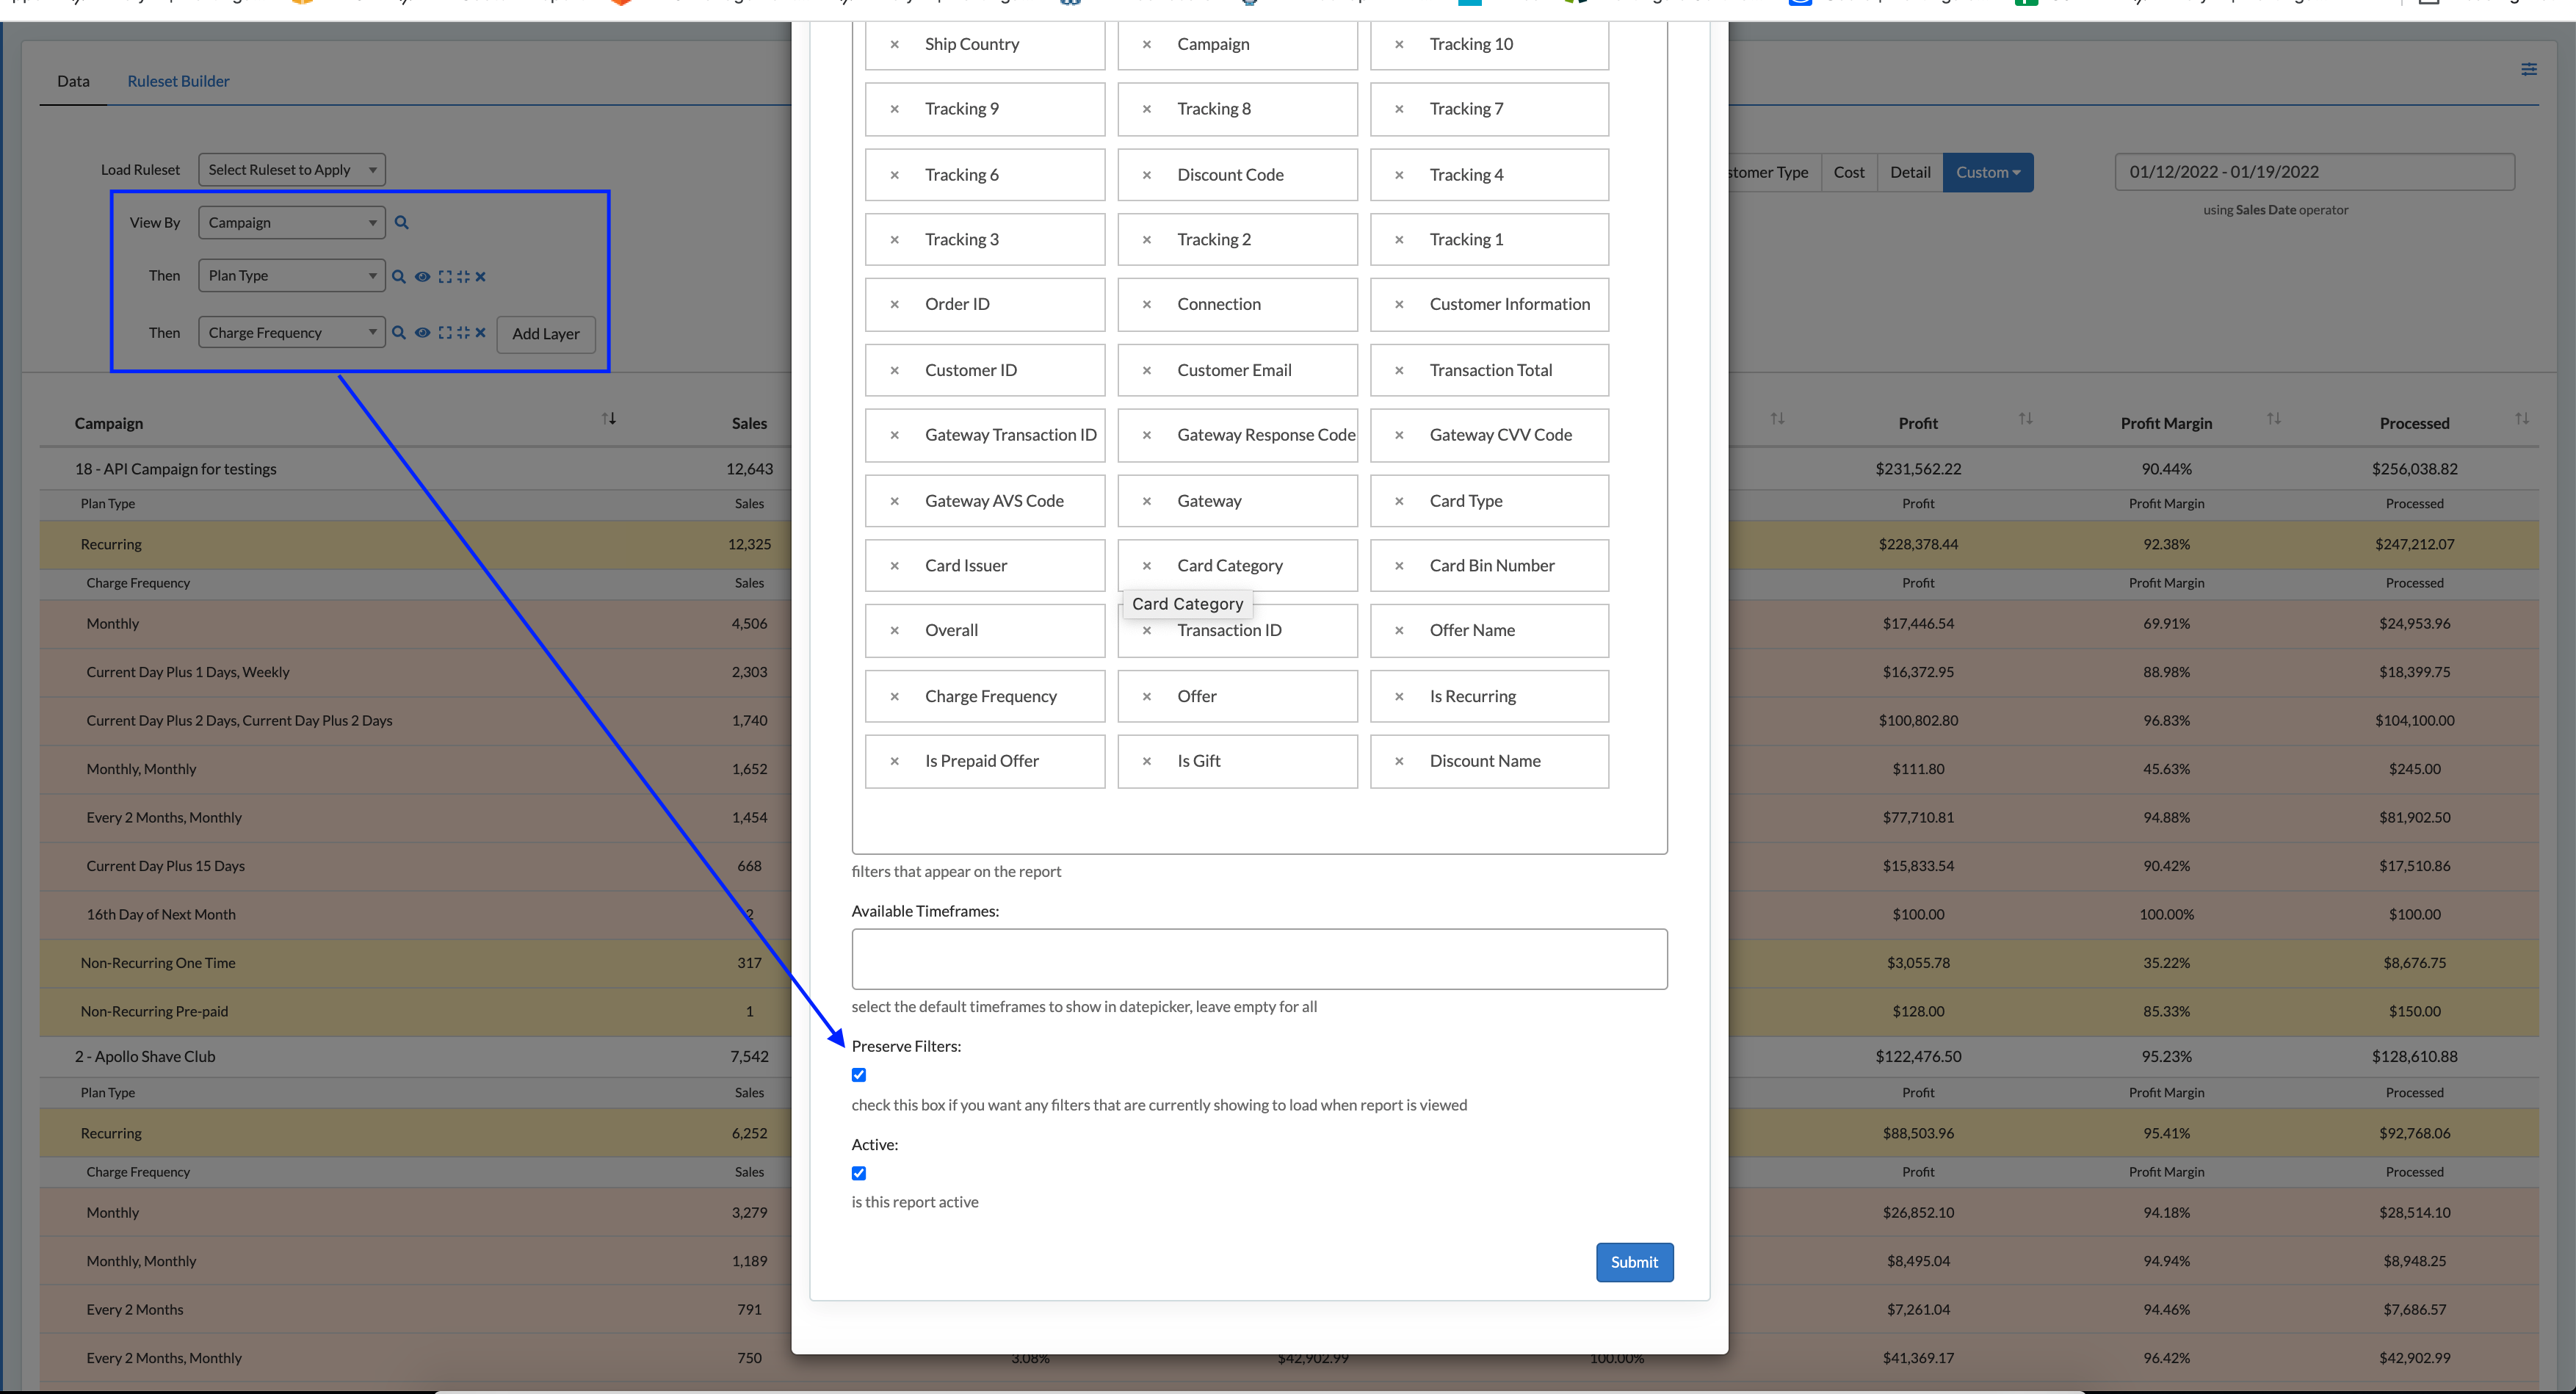
For Example, I like to view my report with 3 filters expanded and only look at 6 metrics that are visible. I am going to Save this report and Preserve the filters so every-time I go to my saved report it will open exactly like this:

Preserve Filters is default on, so any saved report with filters will open as it is saved. 
When saving a report, add a Category to that report to easily group similar reports in your Saved Reports folder.
Edit Report (Custom Report Only)
This option is only available if you're working off of a Custom Report. A Custom Report is any report where you did a "Save As" to save modifications.