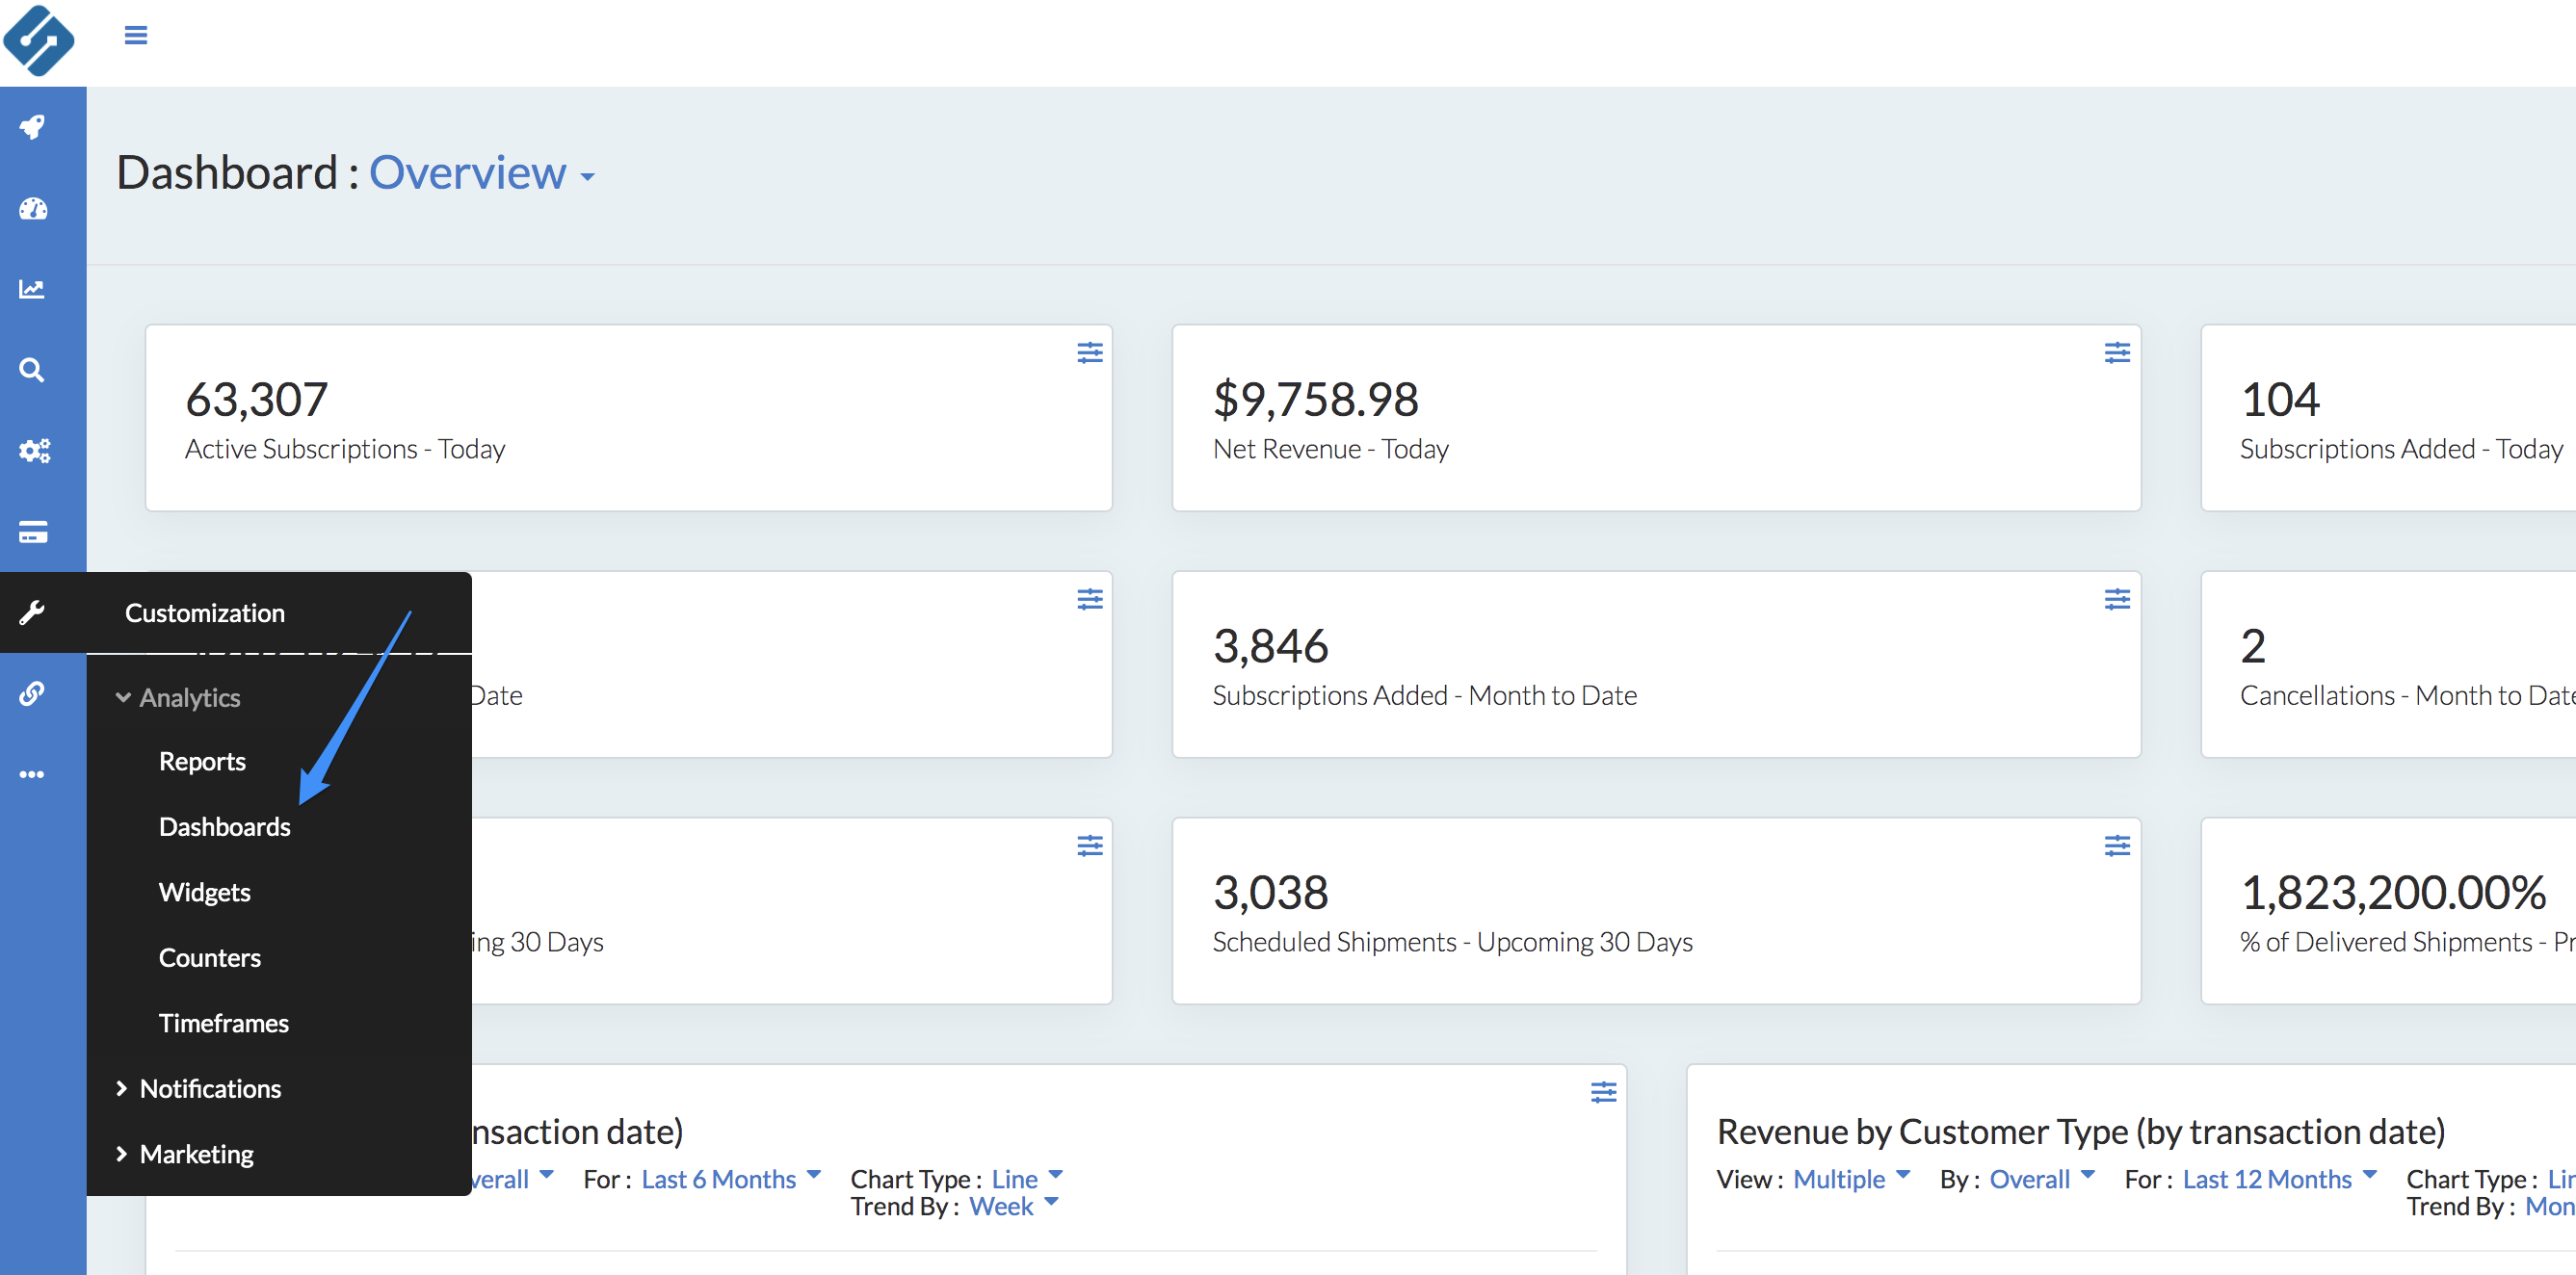
Once you have identified the reports that are most valuable to your business, you'll want to organize them in a way that helps you make the most time efficient and significant decisions. As a first step, you'll want to consider the metrics that are most important to help you keep a pulse on your day to day business. If they are present in the standard Overview dashboard, great! If the standard Overview dashboard needs some adjustments or you would rather create your own unique dashboard, you can easily do so by navigating to the Customization menu, then Dashboards.
Here you will be able to click into the dashboard that you would like to adjust and a configuration panel will appear:
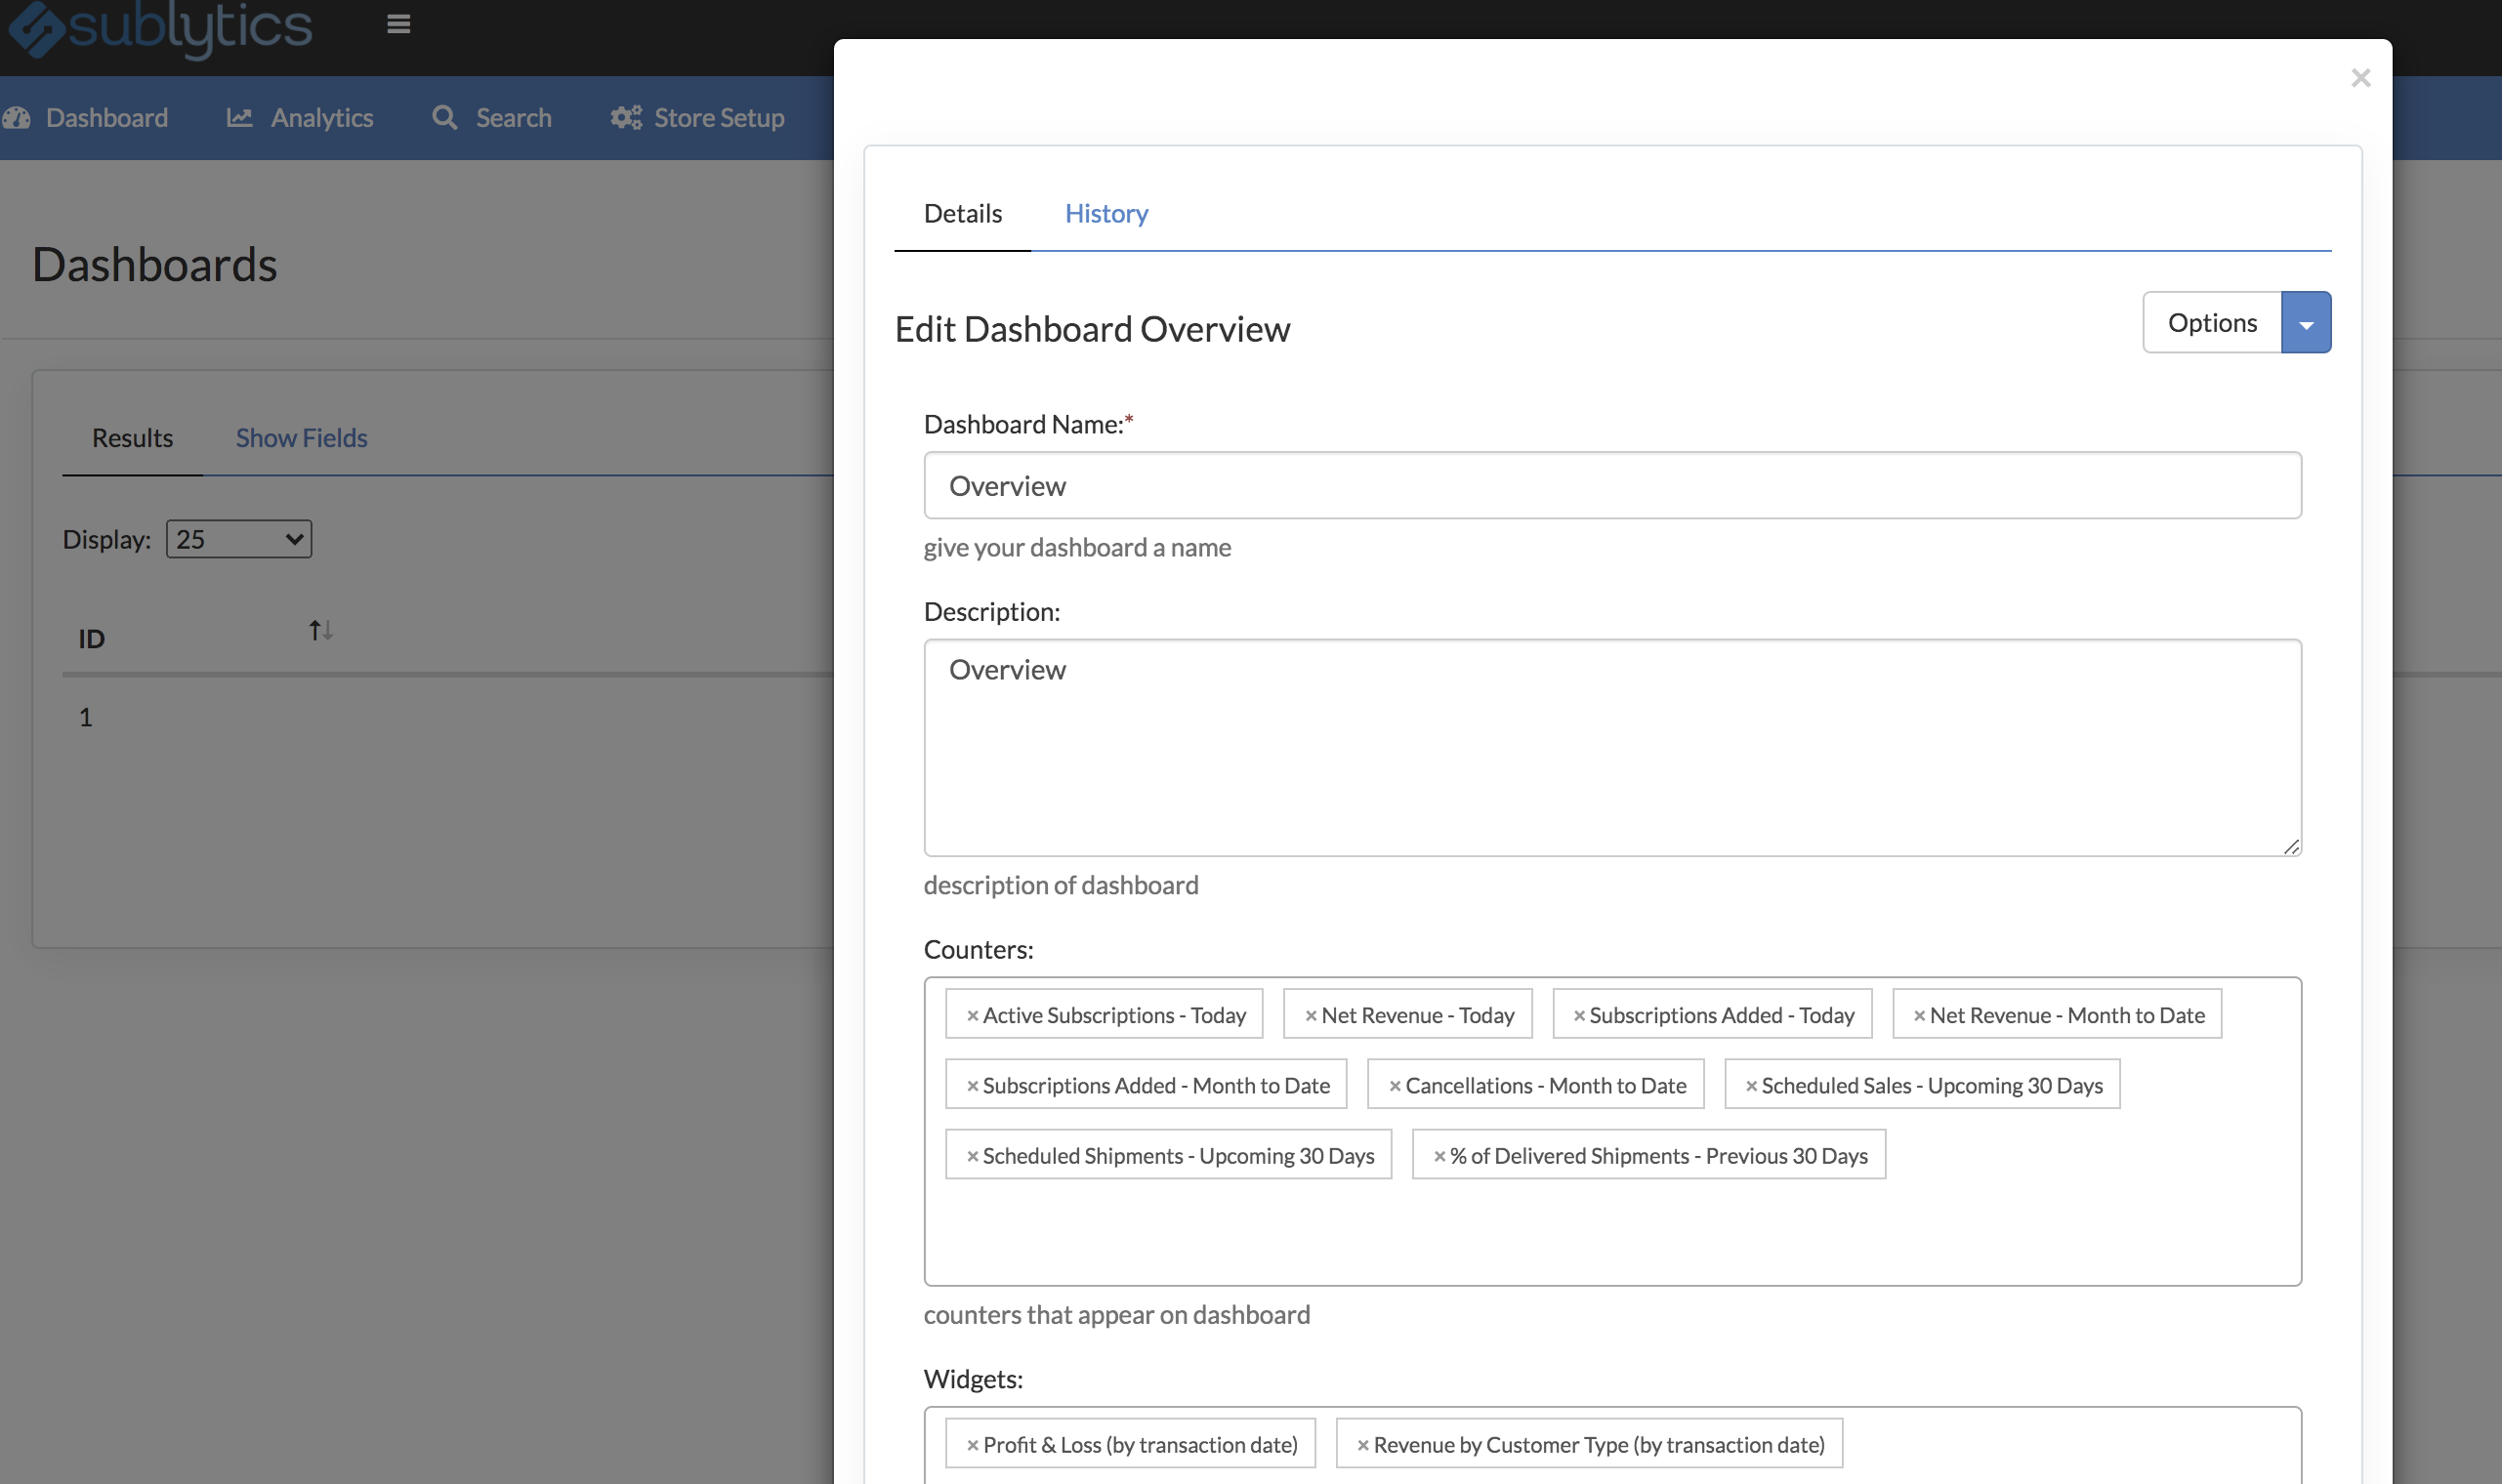
Here you'll want to take note of the Counters, Widgets and Cohorts that are present on the dashboard. If you don't see a Counter, Widget or Cohort currently built that you would like to see, start typing in the name of the element to add it to the configuration panel. If the Widget, Counter, or Cohort does not exist yet, you'll first will first want to create those elements.
Not sure how to create a Widget or Counter? Click here. Want to understand more about how Cohorts are created? Check out our Marketing Cohorts article here. If you have any questions on how Sublytics calculates certain metrics, reference our Glossary here.