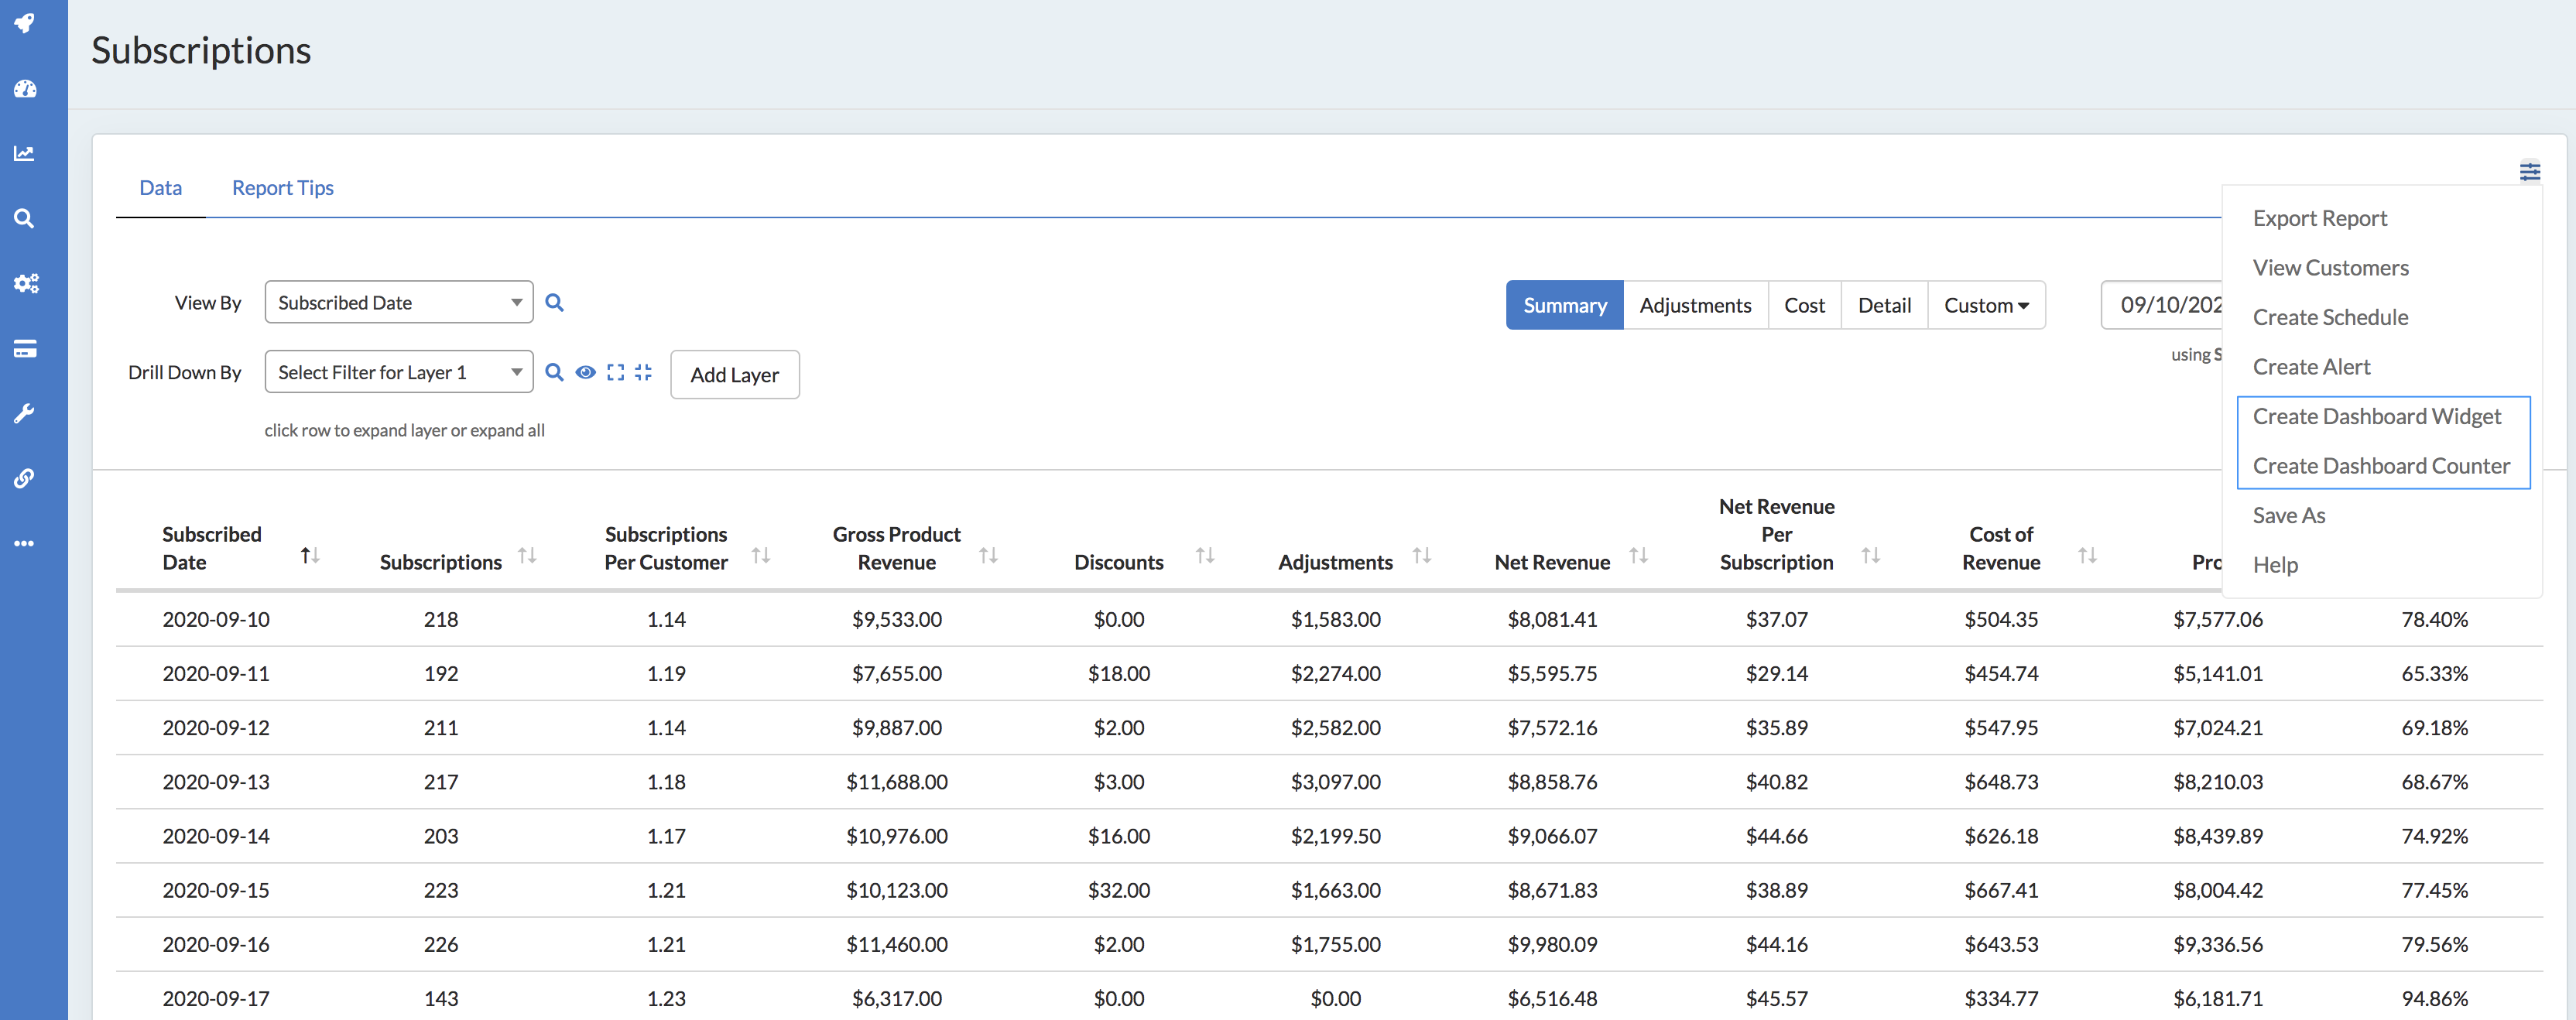
Counters and Widgets are used on your dashboard as snapshots into your most valuable reports. Once you identify the report that is most valuable for the Counter or Widget, navigate to that report and select the options menu on the top right hand corner of the report.
Select Create Dashboard Widget or Create Dashboard Counter, depending on which you want to add to your Dashboard.
Creating a Dashboard Counter
Counters will take one metric from a report and show you a running count based upon the timeframe selected on the configuration panel. Remember this will always tie back to the selected report, so taking note of the Date Operator is crucial. If you would like to see the metric with a different Date Operator, then you should reconsider what report you are building off of. Learn more about our date operators here.
When the configuration panel opens, walk through the setup and make sure to name your Counter something that you will recognize when editing a dashboard. Select your Timeframe and Metric and dashboards (if they exist already) that you would like to add the counter to.
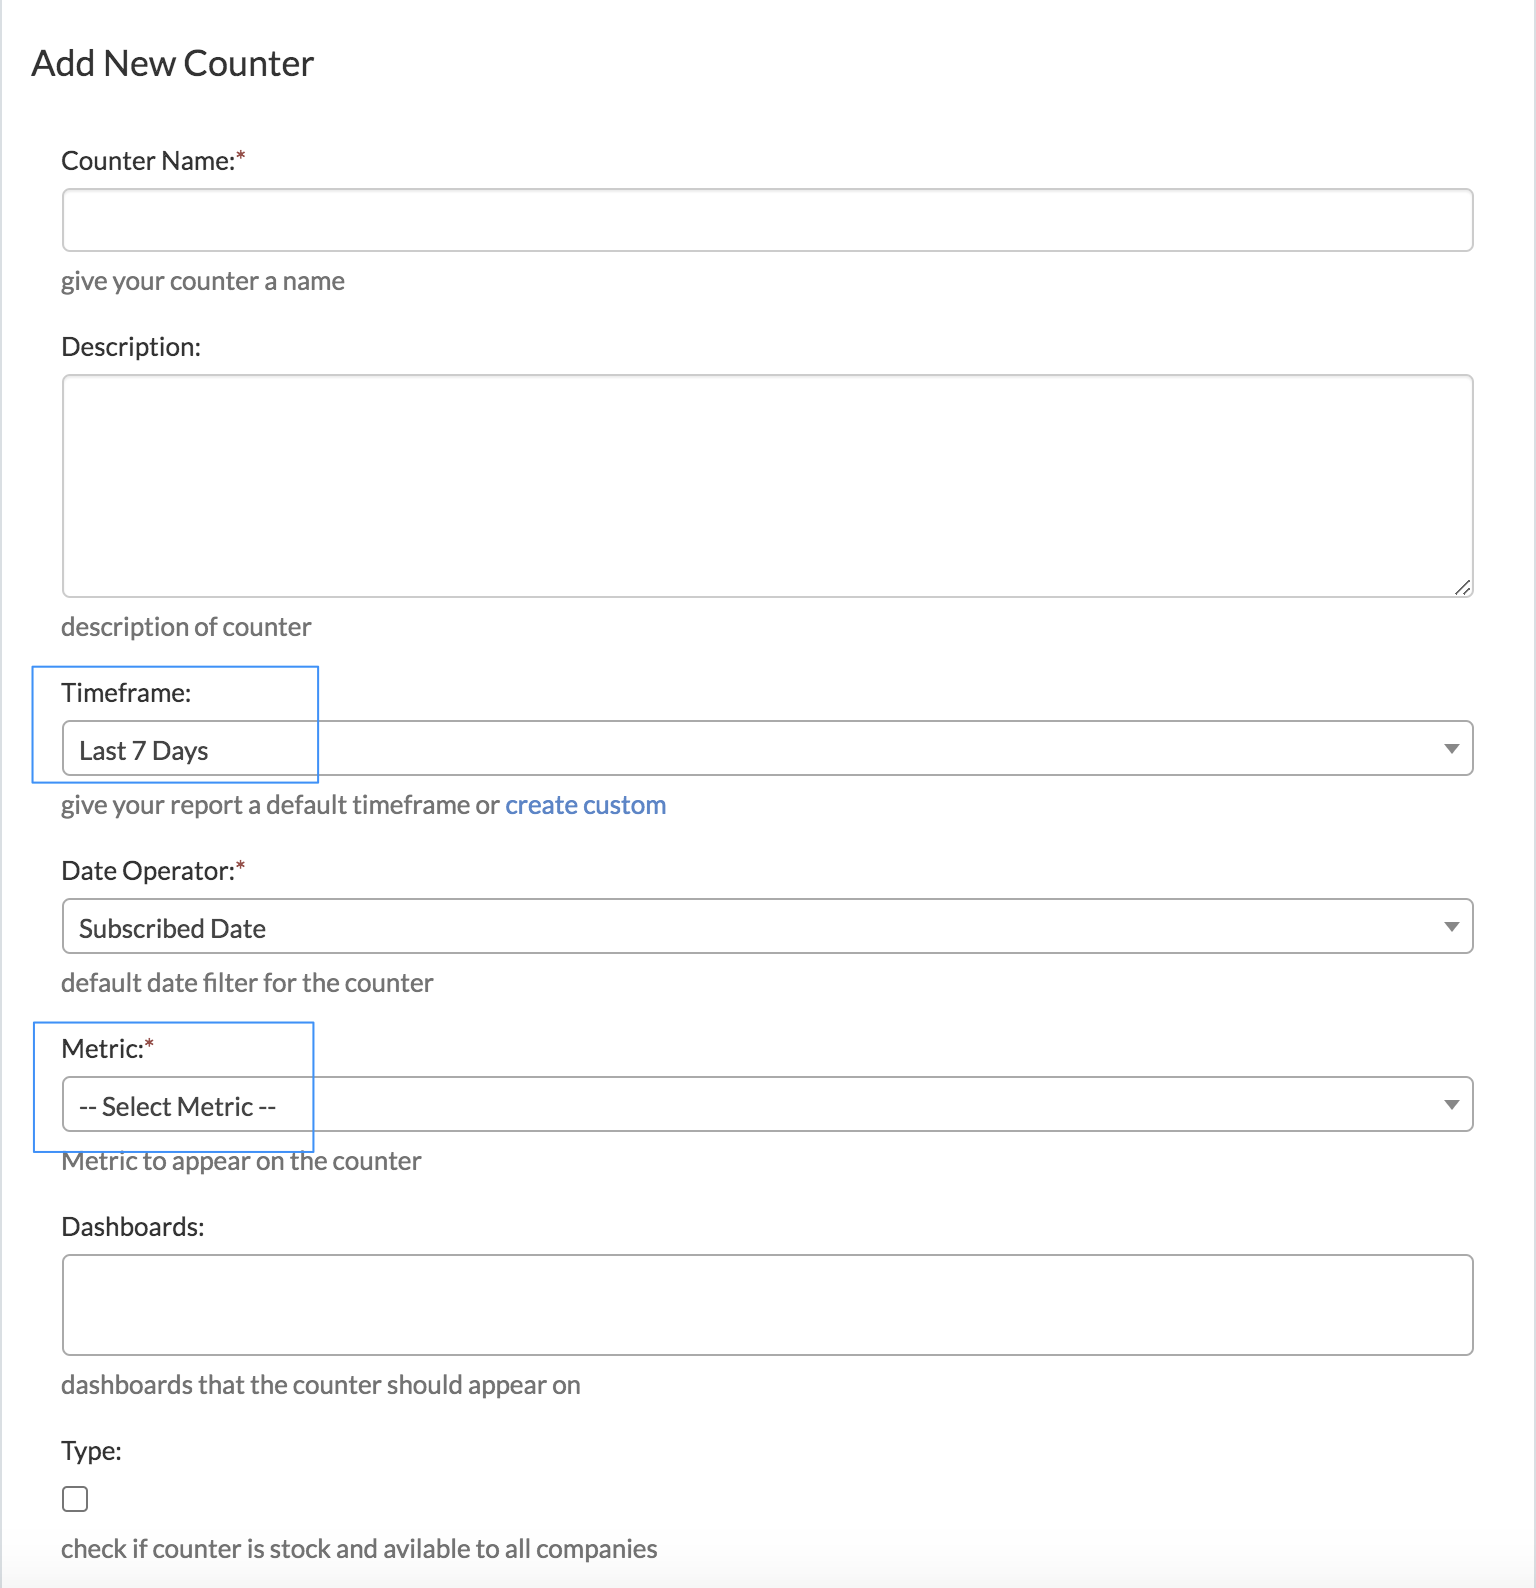
Select Submit to save, and you will see the counter either on the dashboard you selected or as an option when you create a new dashboard.
Creating a Dashboard Widget
For a Dashboard Widget, you will follow the exact same steps, with the addition of needing a graph type within the widget. Select your desired timeframe, type of graph and which metrics you would like to show. These are great ways to show your businesses weekly progress on your dashboard.
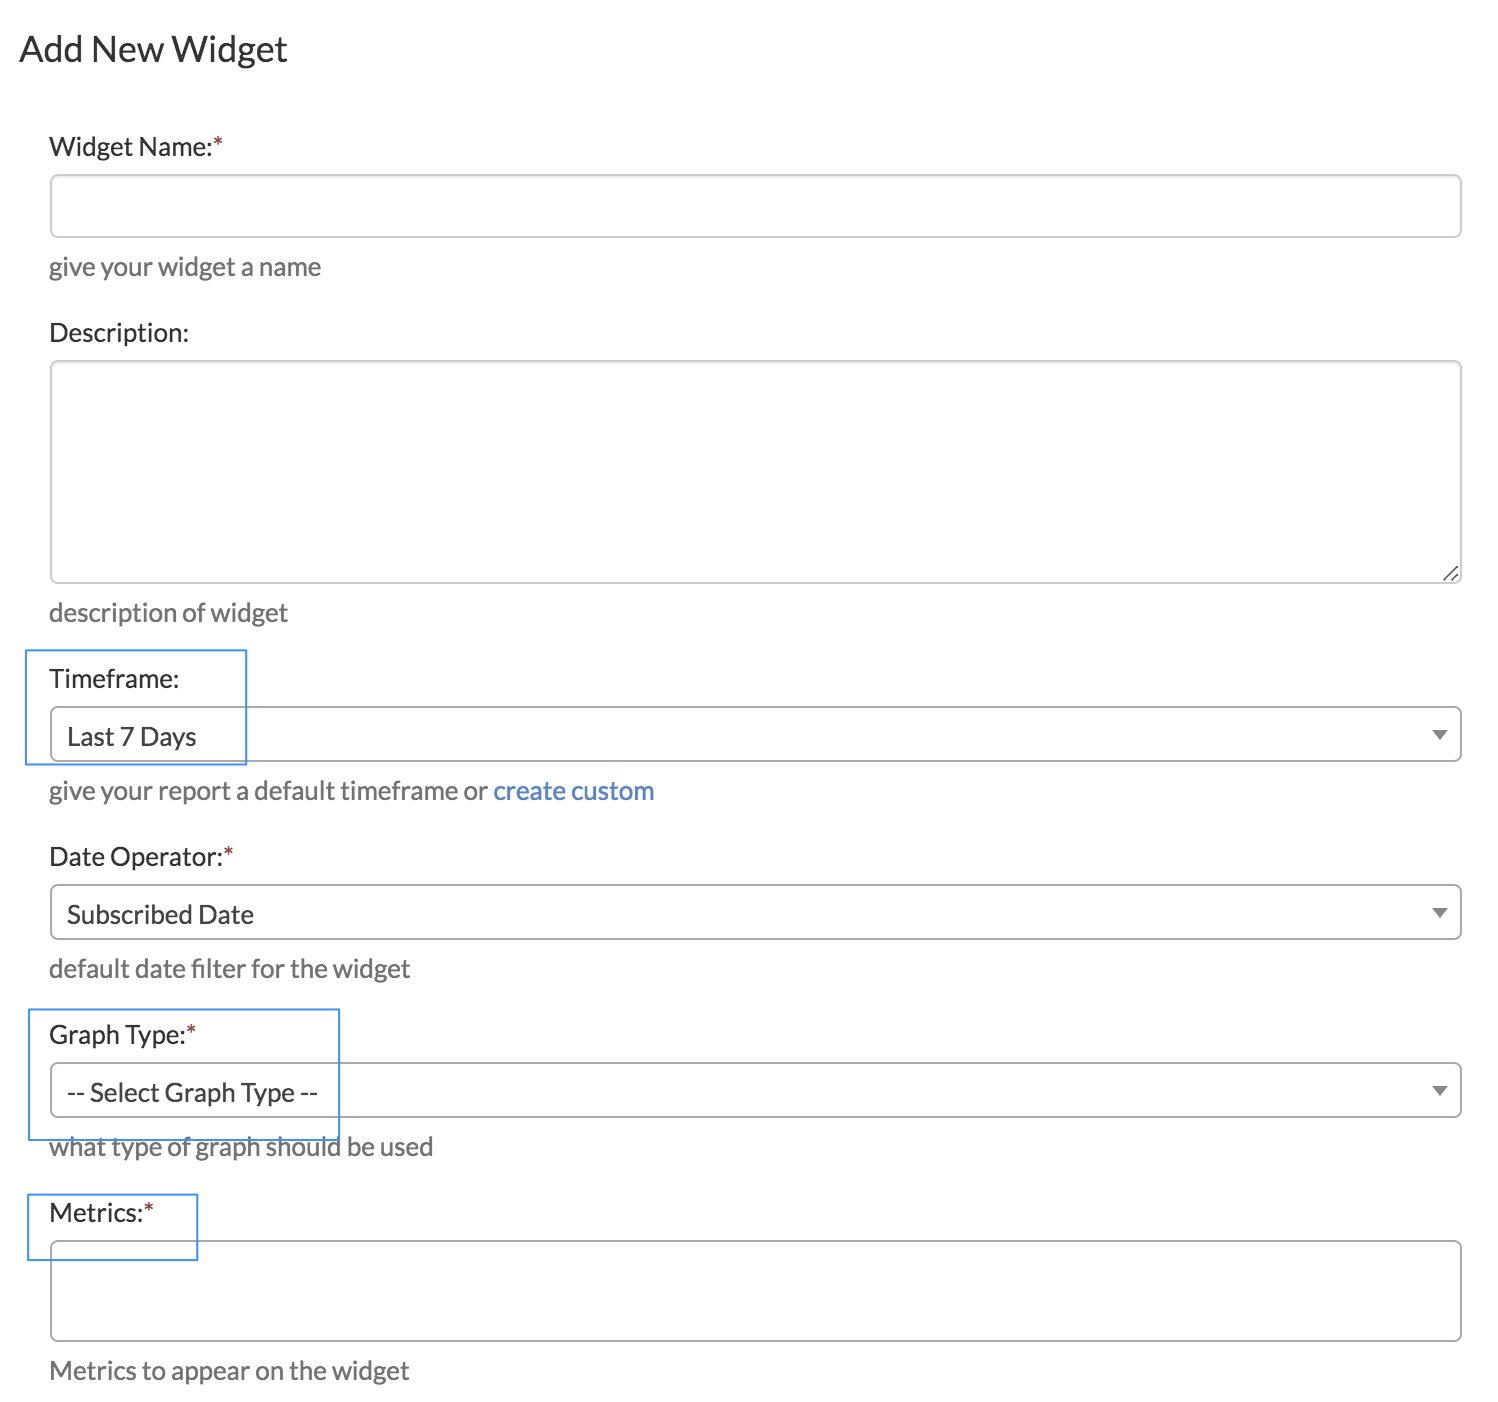
As with counters, you can select the dashboard that you would like this added to or you can submit and plan to add it to a dashboard later. Adding it to any dashboard will help you validate it is showing the information you would like to see. Learn more about creating dashboards here.