Sublytics Report navigation can be broke down into 3 categories:
Basic Navigation
Each report within Sublytics has the exact same layout. The main differences between each report are:
- Date Operator
- Data Columns ; predefined and custom
- Starting Filter
When beginning to navigate through Sublytics it is very important to know what date operator drives that report, as this will determine all underlying data for the report.
Initially the end user should confirm: What is the date operator, what is the starting filter and what is the date range:
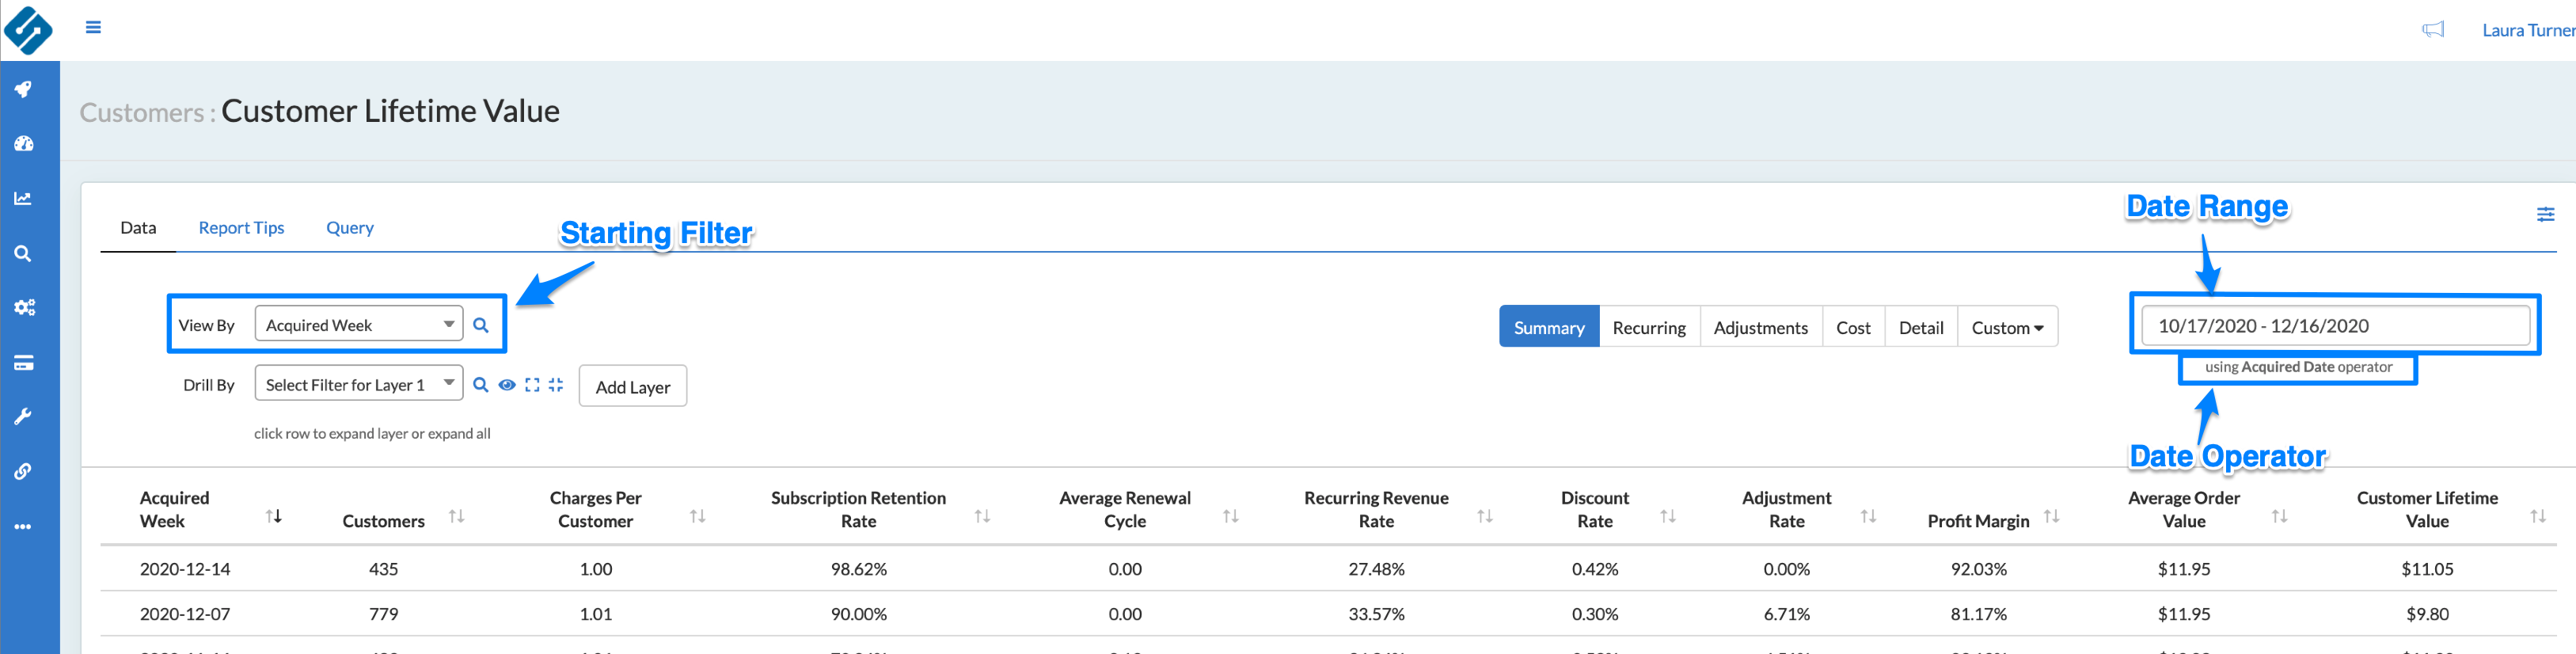
Sublytics has a predefined summary view and set the starting filter for each report based on the most useful way to answer high level data questions. These can easily be adjusted through customization.
| Helpful Tips for Navigation | |
|---|---|
| Refunds |
Full refund, the negative refund value is reflected on the offer, shipping & tax. Partial refund, the negative refund value is a weighted average across all offers within the sale and adjusted shipping and tax will reflect this as well |
| Metrics | All column headers will give a definition of the metric and/or the formula calculating that metric when hovered over the column |
| Date Type | Each report has a set date operator that provides the logic for the timeframe of that report. Each date operator will have an explanation of the timeframe when you hover over it. |
| Filters | Filters will allow you to view your data on a granular level. Data points accessible via the customer profiles are included in filters, allowing high level data view down to a very granular level as filters continue to drill down |
| Revenue Calculation | By default, Sublytics Revenue metric includes shipping and excludes tax. To change how revenue is calculated, set calculation setting under company profile |
From here the user can begin to customize your report.
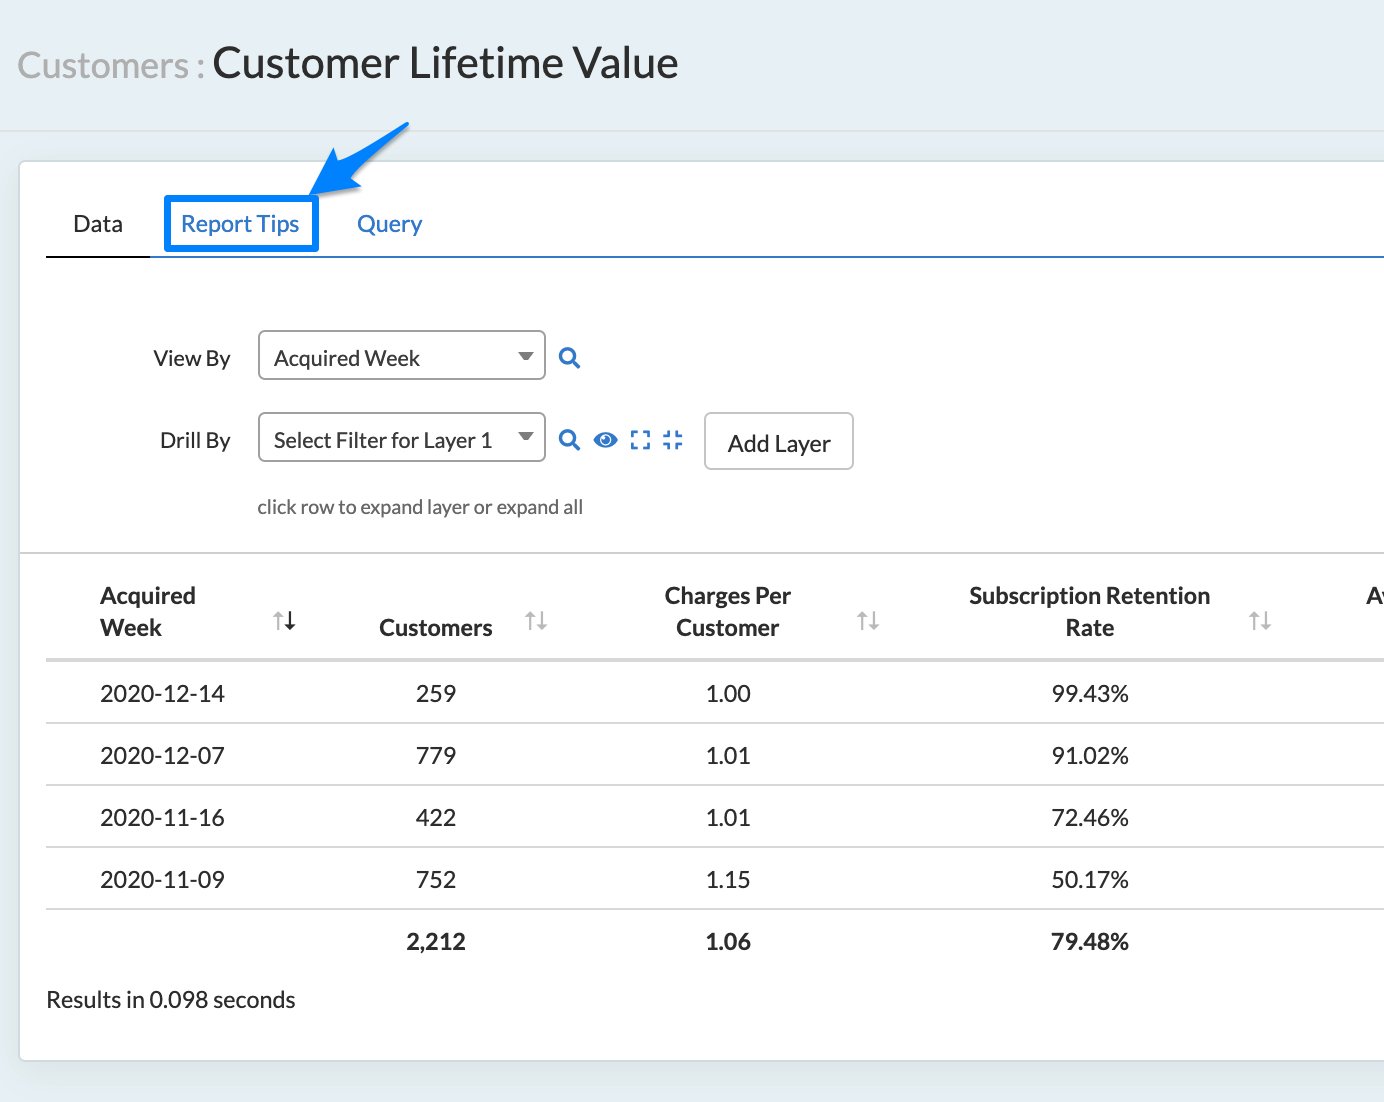
Want more information on each specific report? Check out the Report Tips tab located in every report. This will give you good insight on the specific report, use cases and more!
Customization
Nearly every aspect of Sublytics is customizable to fit any specific business needs and data goals. Customization of reports allows a user to drill into the specifics of their business, save reports and create automated action items from those reports.
Customization is possible through:
- Filters
- Column Views
- Dates
- Timeframes
- Dashboards
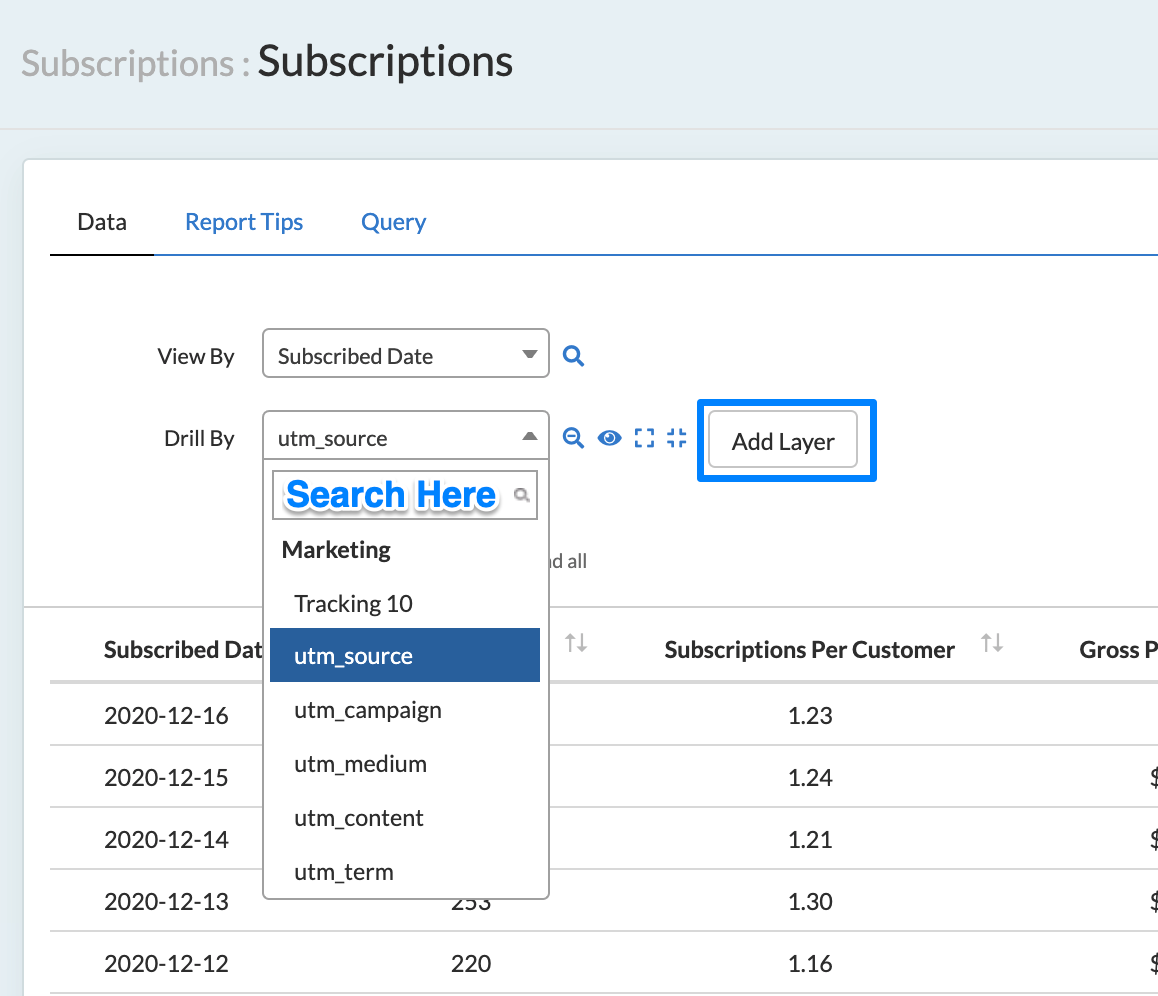
Every report offers numerous filters to allow the user to drill into data. There is no limit on the number of filters that can be used. 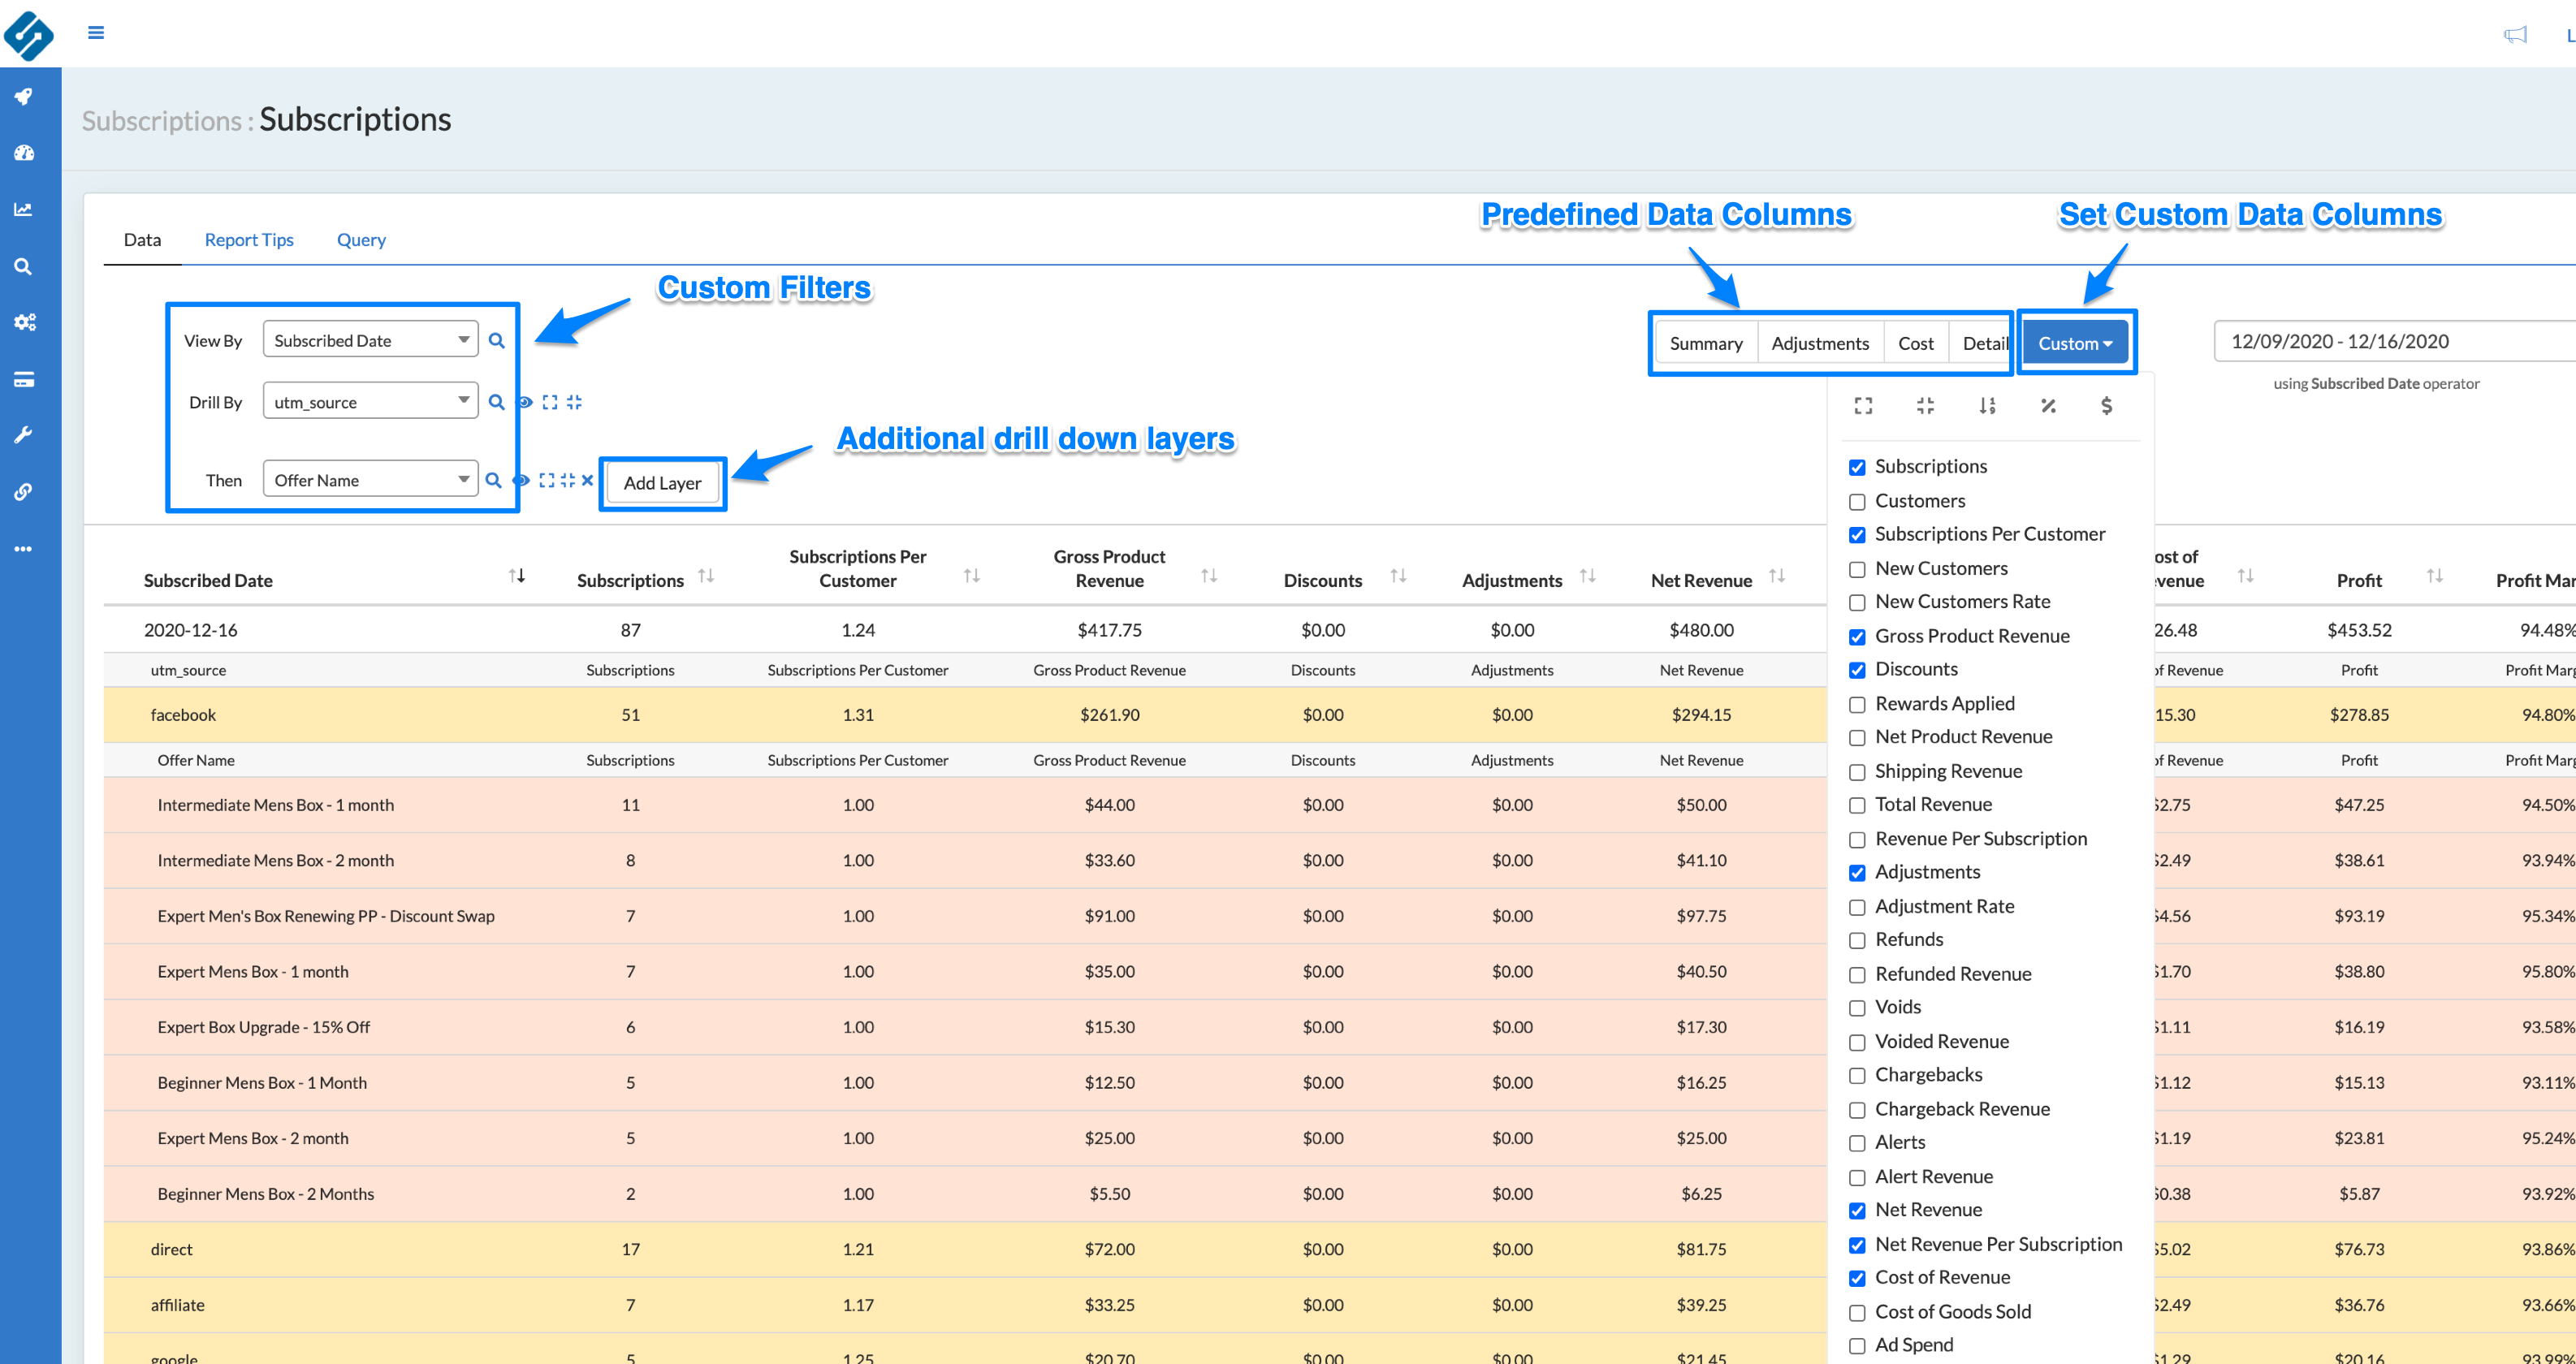
Filters
Sublytics gets as much information surrounding marketing, sales, fulfillment, program type and more in order to aggregate on a customer level and provide the end user to drill into different aspects. Each report opens up every filter for that data table to allow analysis on a drill down level.
Every report offers numerous filters to allow the user to drill into data. There is no limit on the number of filters that can be used.
Filters are grouped into categories for easy navigation, or through simply searching. Add as many filter layer to continue to drill into the specific data
Advanced Filter Options
Within each filter layer, there are different advanced options:
| Icon | Action |
|---|---|
 |
Search ; allows you to search the filter layer for something specific. |
 |
Quick Filter ; Limits data to specific selected filter |
 |
Expand and Collapse ; Quick way to view / hide filters |
Search
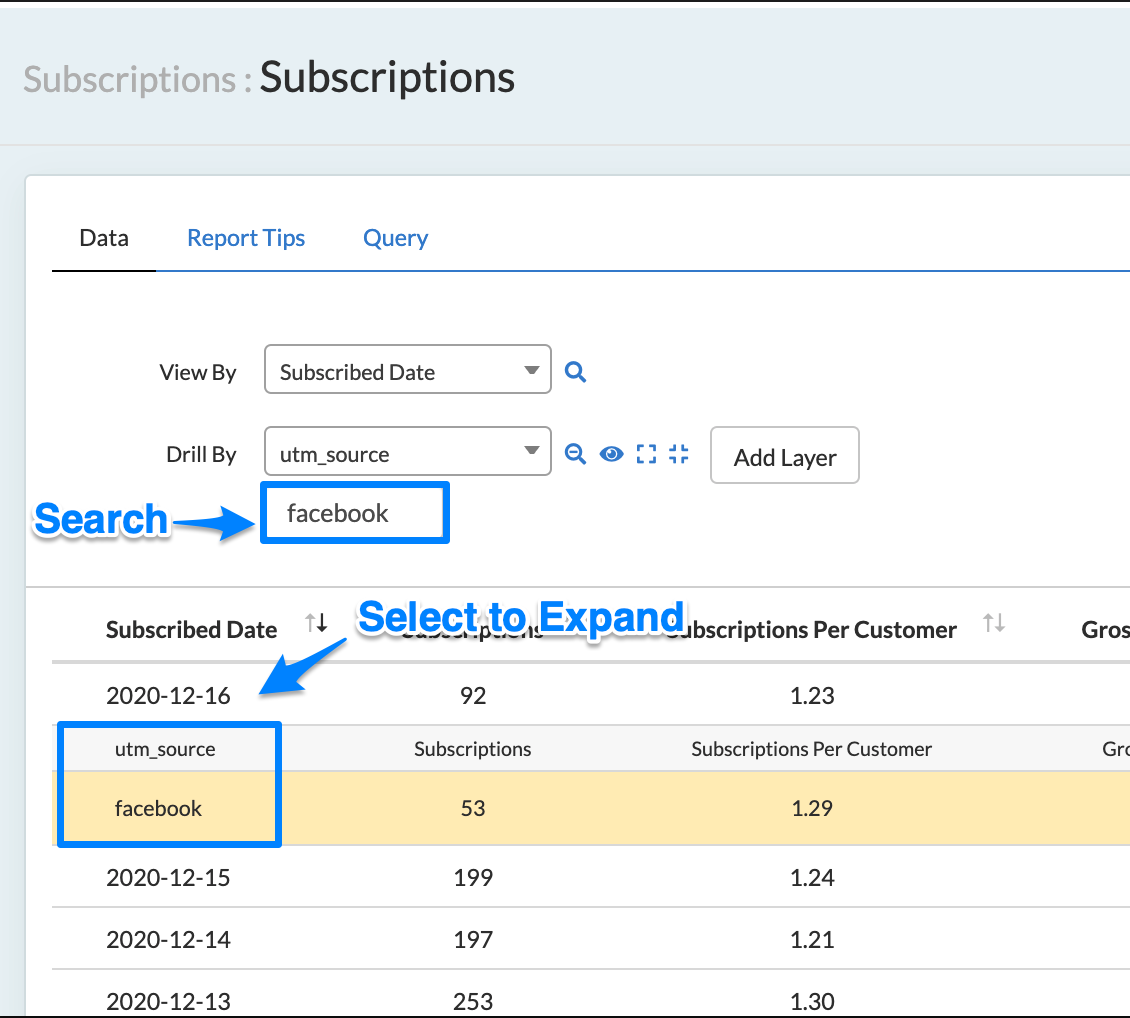
To search, select the magnifying glass icon on the filter you wish to search into.
Search allows you to search the filter layer for something specific. In this example, searching for UTM Source = Facebook. Another example would be to search for a specific Customer Email address or Customer ID.
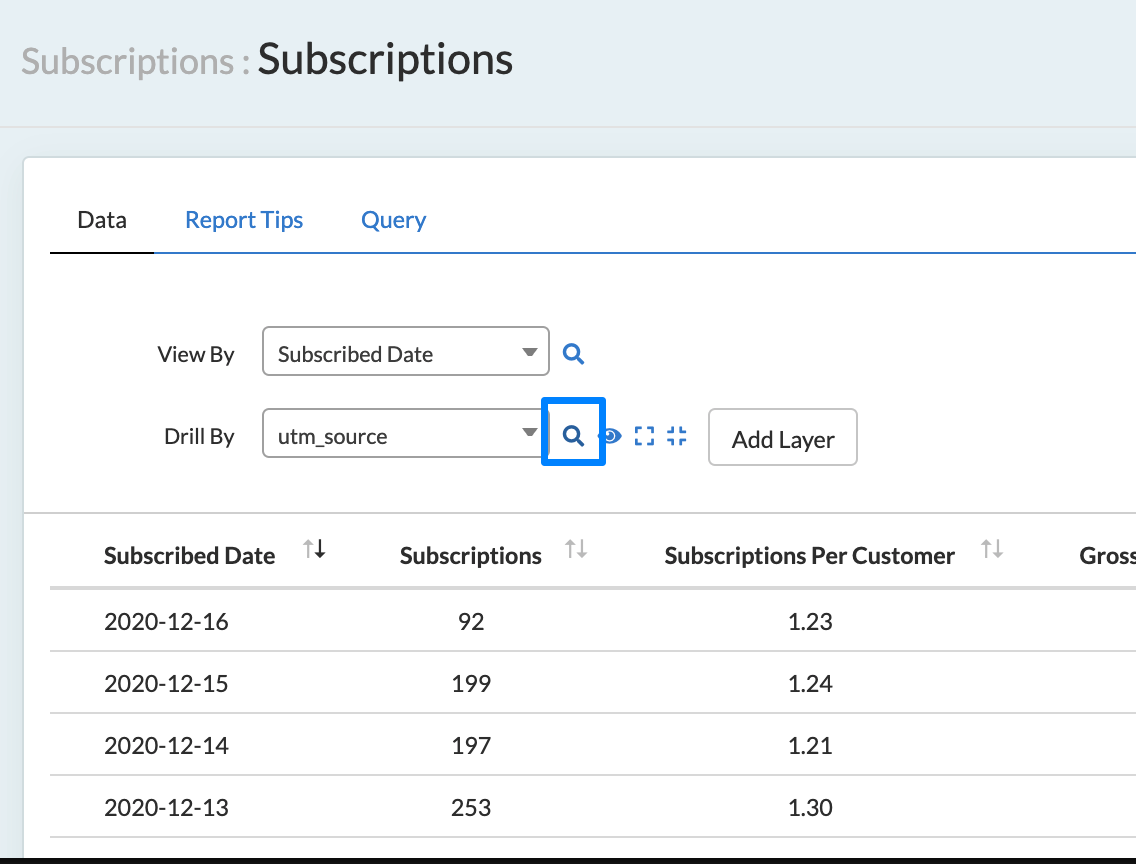
Input what you wish to search for within the Search Box and click on the row you want to search within. Only that searched filter will expand.
Quick Filter
The Quick Filter option allows the user to limit the data to that specific result. This removes all other data points from the report entirely.
Use Case Example
A business has multiple UTM sources driving subscriptions that all aggregate within Sublytics. The business wants to see how one specific UTM Source is performing. The starting filter would be UTM Source, next the Quick Filter would be selected and the user would click on the Source they wish to study.
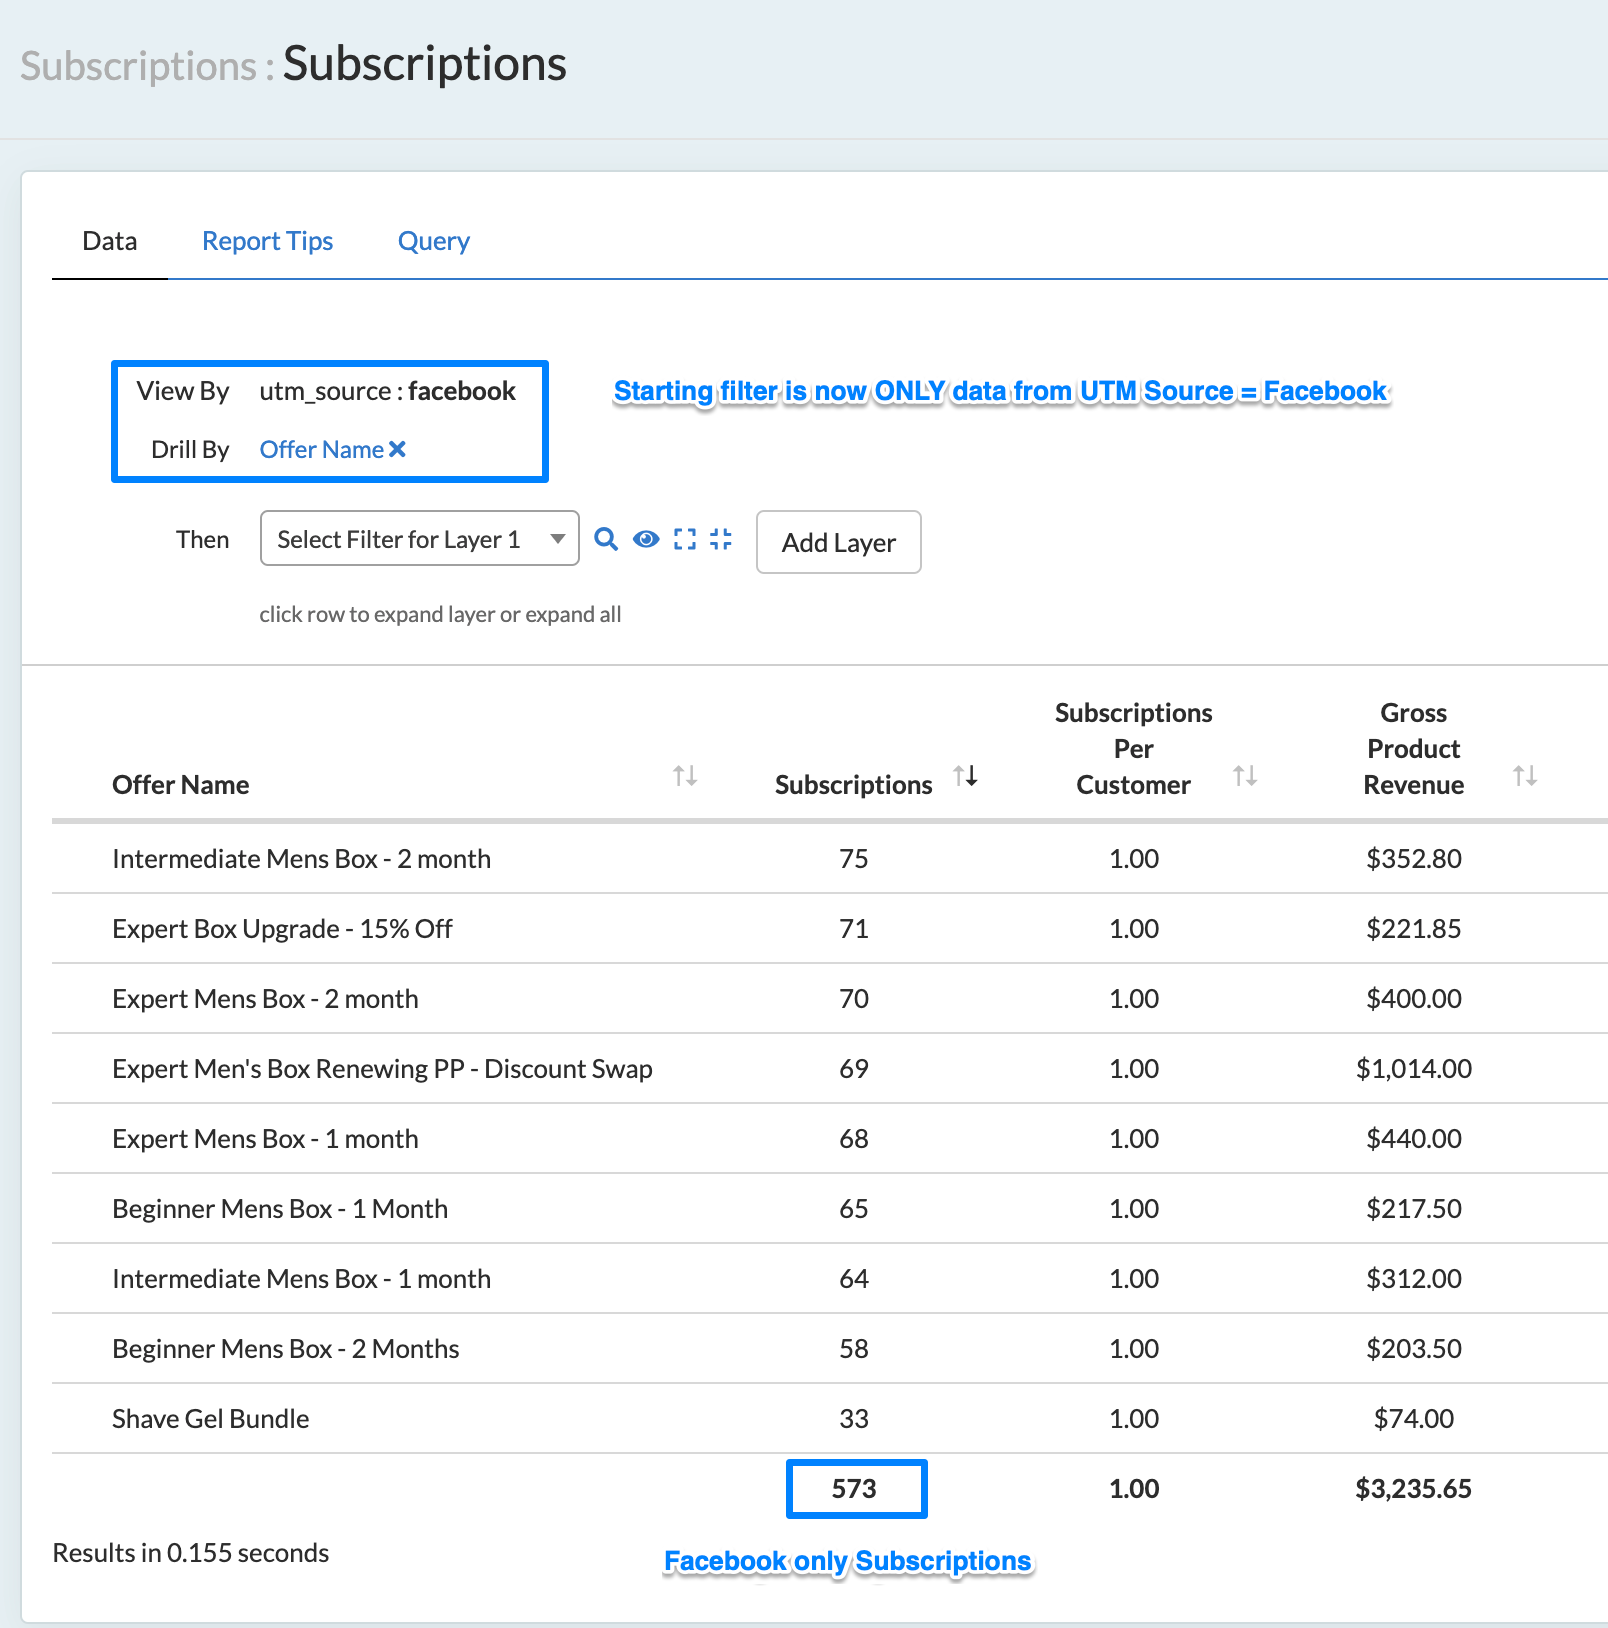
In this example, the user wants to see what Offers their UTM Source Facebook is driving:
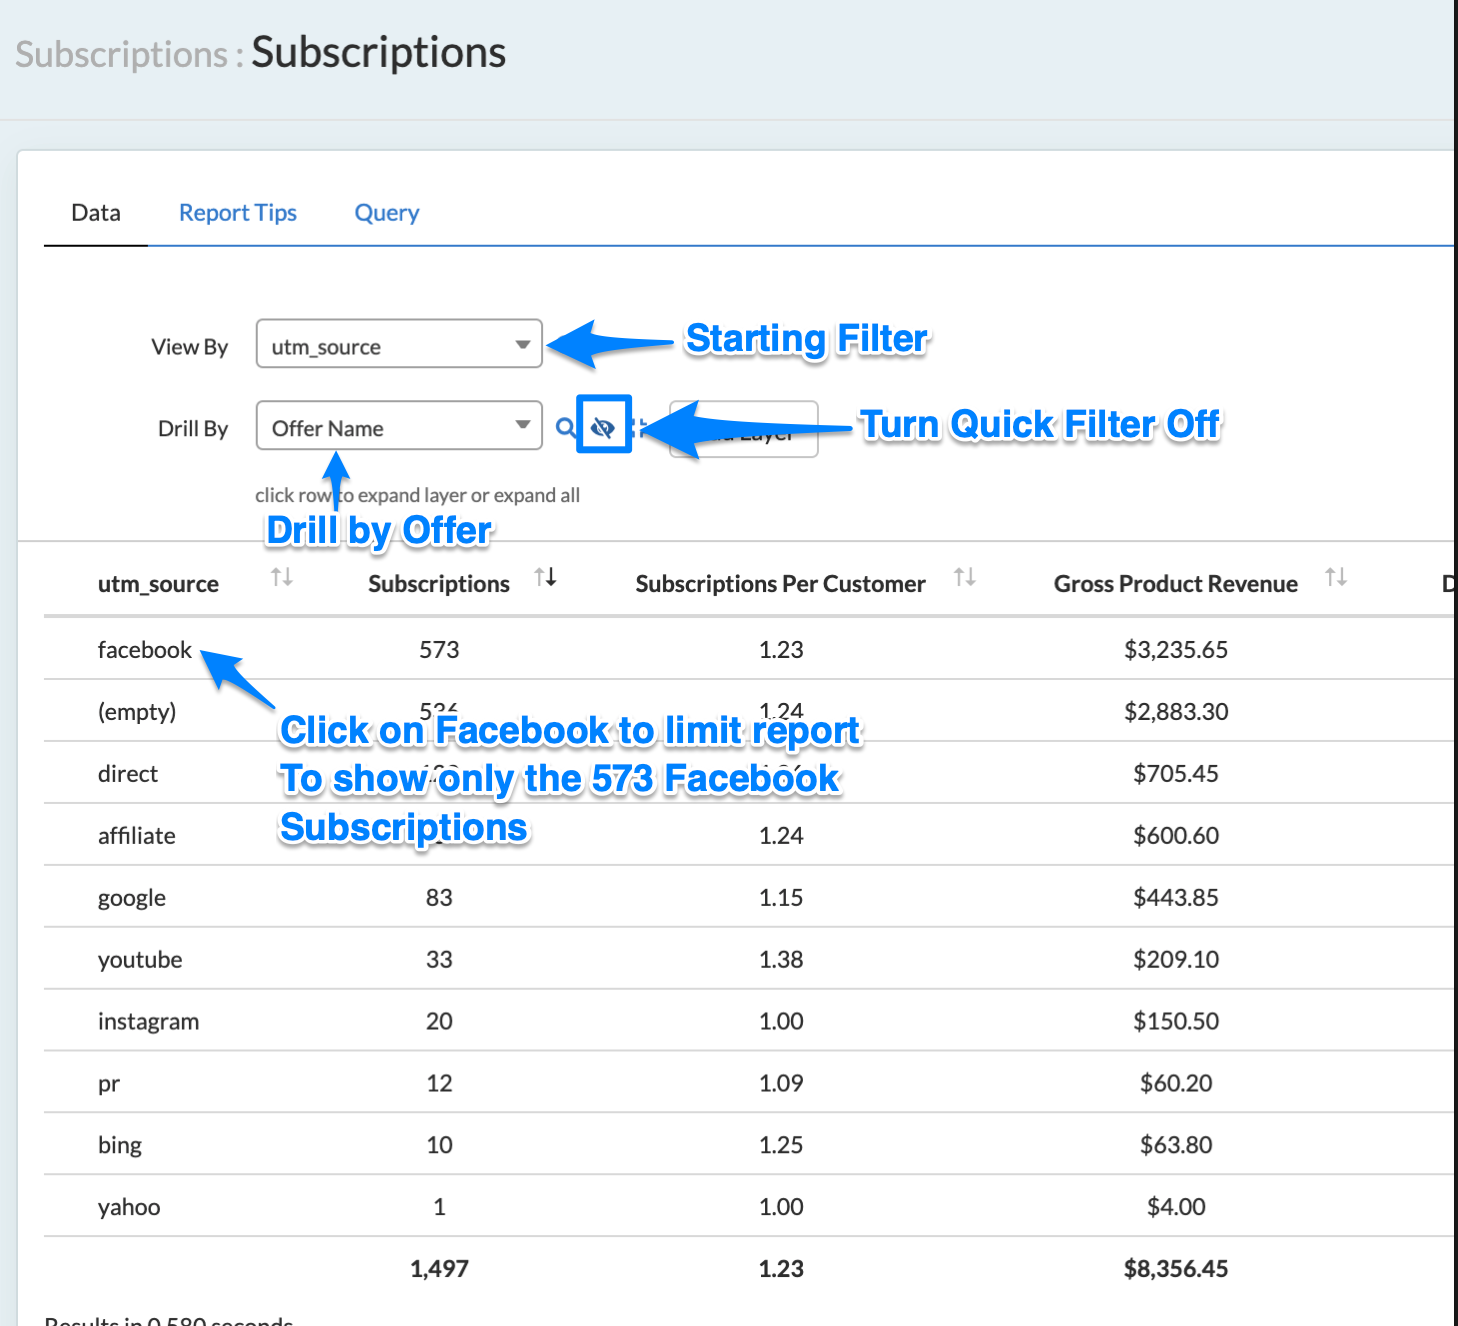
Once Facebook has been selected, only those 573 Facebook Subscriptions are in the report
Other use case examples would be if a business has multiple stores and they want to analyze one particular store. Or if a business uses 3 different Fulfillment Centers, but wants to just see how 1 Center is performing.
Why use Quick Filter Feature?
Looking at aggregate data can give a great high level view. But when drilling down to answer specific questions, sometimes too much data can muddy the view. Quick Filter allows the end user to limit data at the top level to specific parameters, while still having access to drill down into that top level. This removes the excess data from the view making analysis of that parameter clear and concise.
Quick Filters can be used on multiple layers to get the dataset to the precise view as wished. For example, you can Quick Filter your layer to view by a specific connection. Then drill in and Quick Filter to a specific Campaign. Next Quick Filter into a specific Offer. There are no limitations on the number if times a Quick Filter can be used.
Expand/Collapse
This feature allows the end user to expand, or open all filters, with one click. Similarly, once all filters are open the collapse option allows the user to quickly collapse, or close all filters.
Column View
One report can answer many different use case questions based on the data output for that report.
To simplify this for easy digestion, Sublytics has multiple pre-defined views based on specific data points. Each report also allows for a custom view based on any data point selected.
Toggle between the different pre-defined views, or select custom for a drop down of all data points in that report.
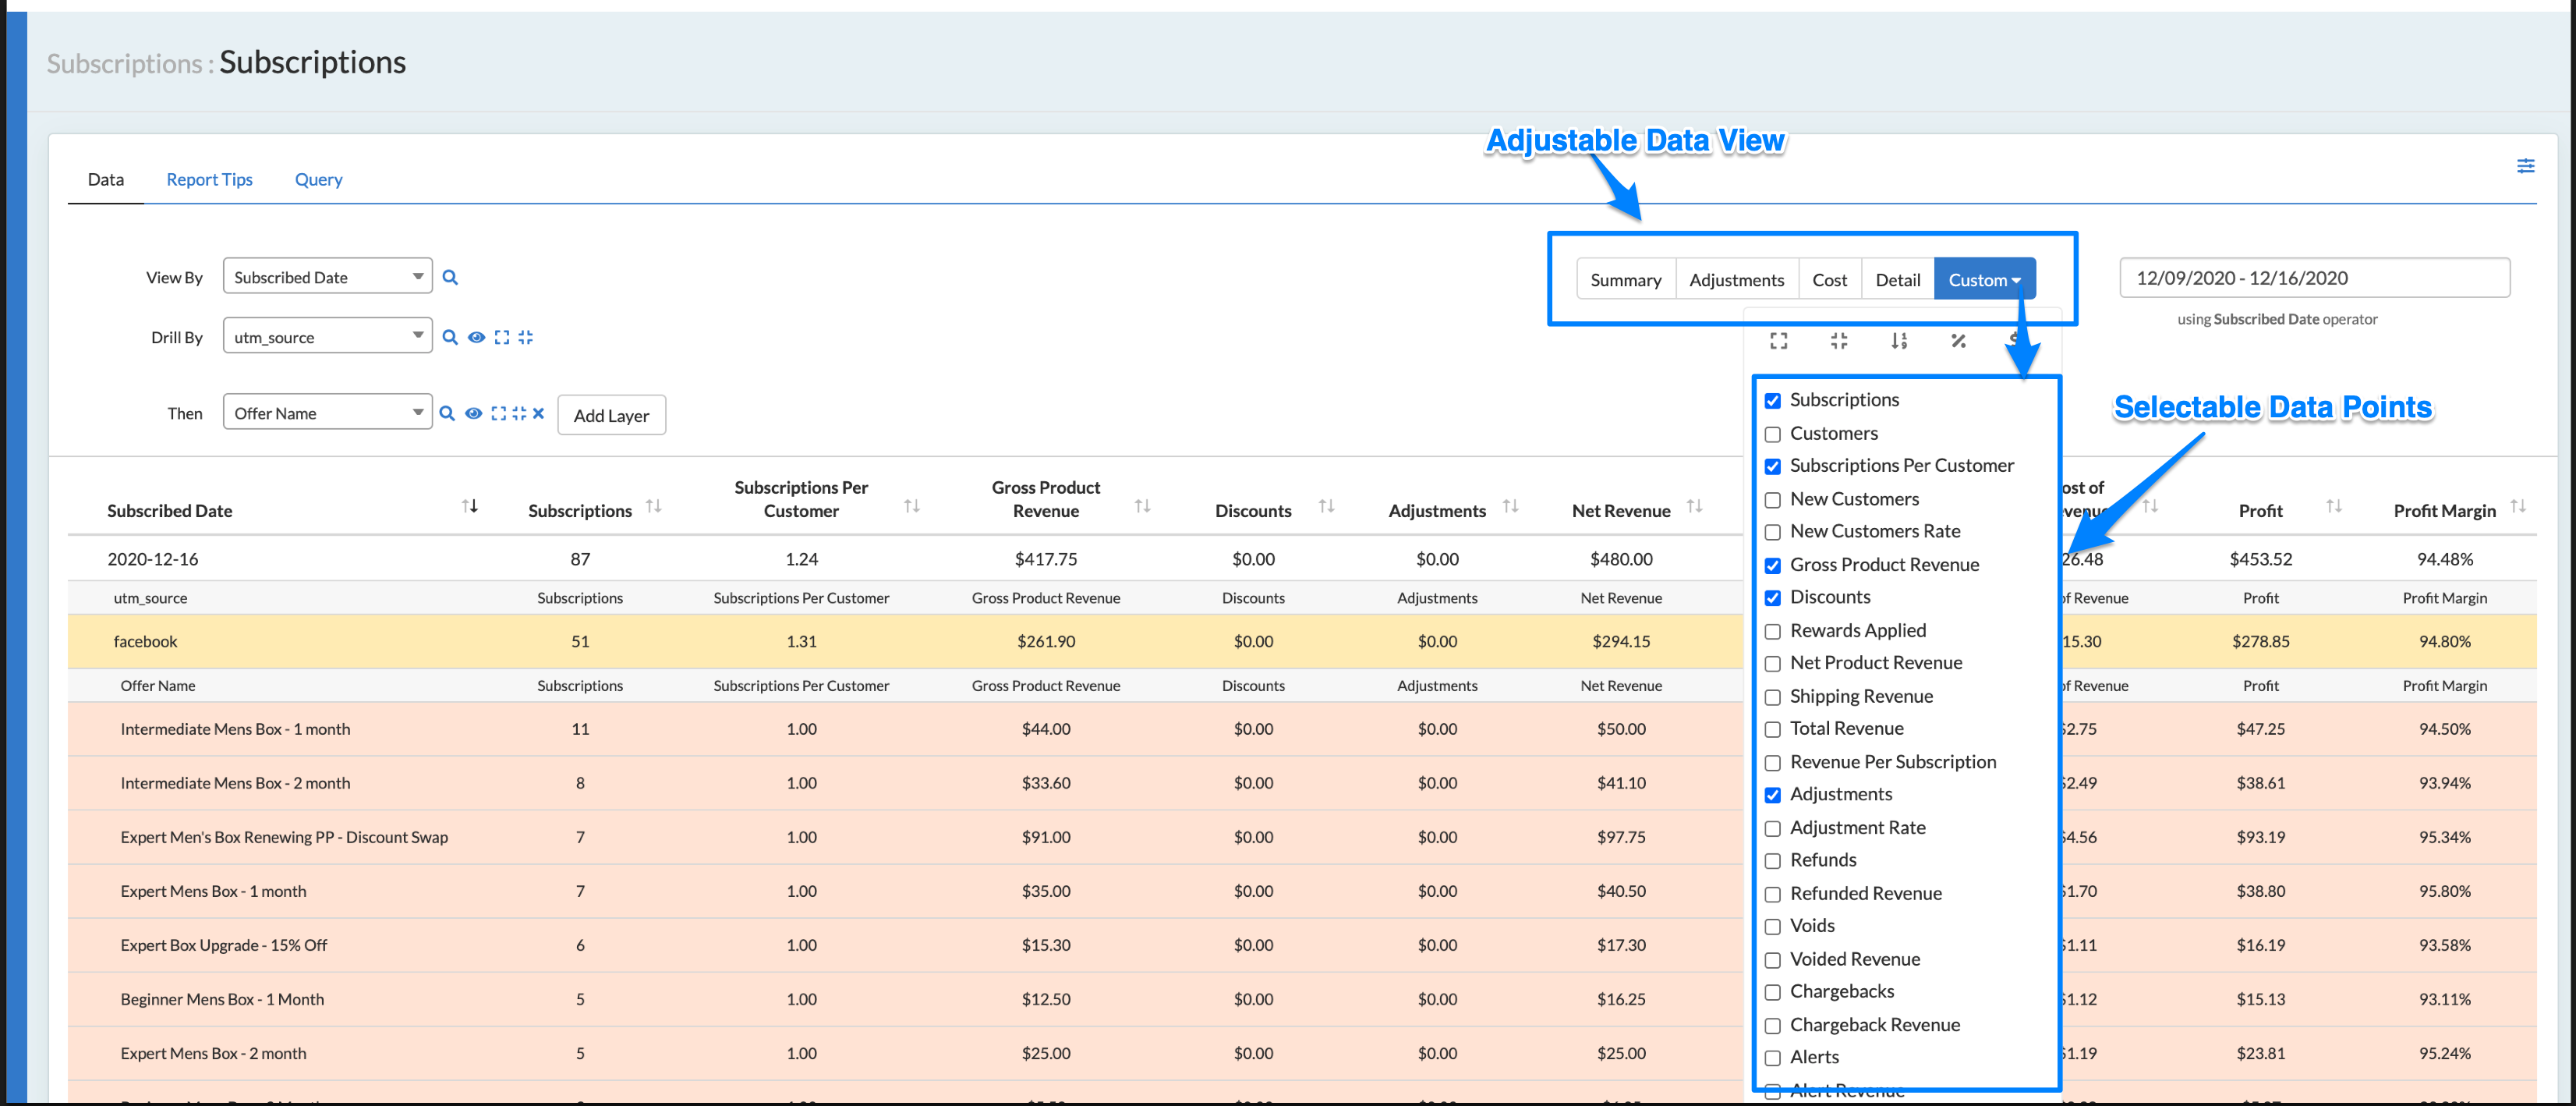
In the Custom drop down tab, there are options to group the custom views. Select one of these options will limit the columns. These are not limited to what is predefined or selected based on the icon.
For Example, the Percentages Only can be selected then additional columns can be turned on. There are no limitations to the data columns that can be in view.
| Icon | Explained |
|---|---|
 |
Show All ; All columns will be select and displayed on the report |
 |
Hide All ; All columns will be removed from the report |
 |
Counts Only ; Only Data Columns that are numeric counts will be displayed |
 |
Percentage Only ; Only Data Columns that are percentages will be displayed |
 |
Revenue Only ; Only Data Columns that are a revenue item will be displayed |
Dates
The date operator for each report is set. This is one of the only items on each report that is not customizable and cannot be changed.
The Timeframe that the report uses is customizable.
Sublytics has Predefined Dates or allows custom date range. Simply by clicking on the date will expand the option to adjust.
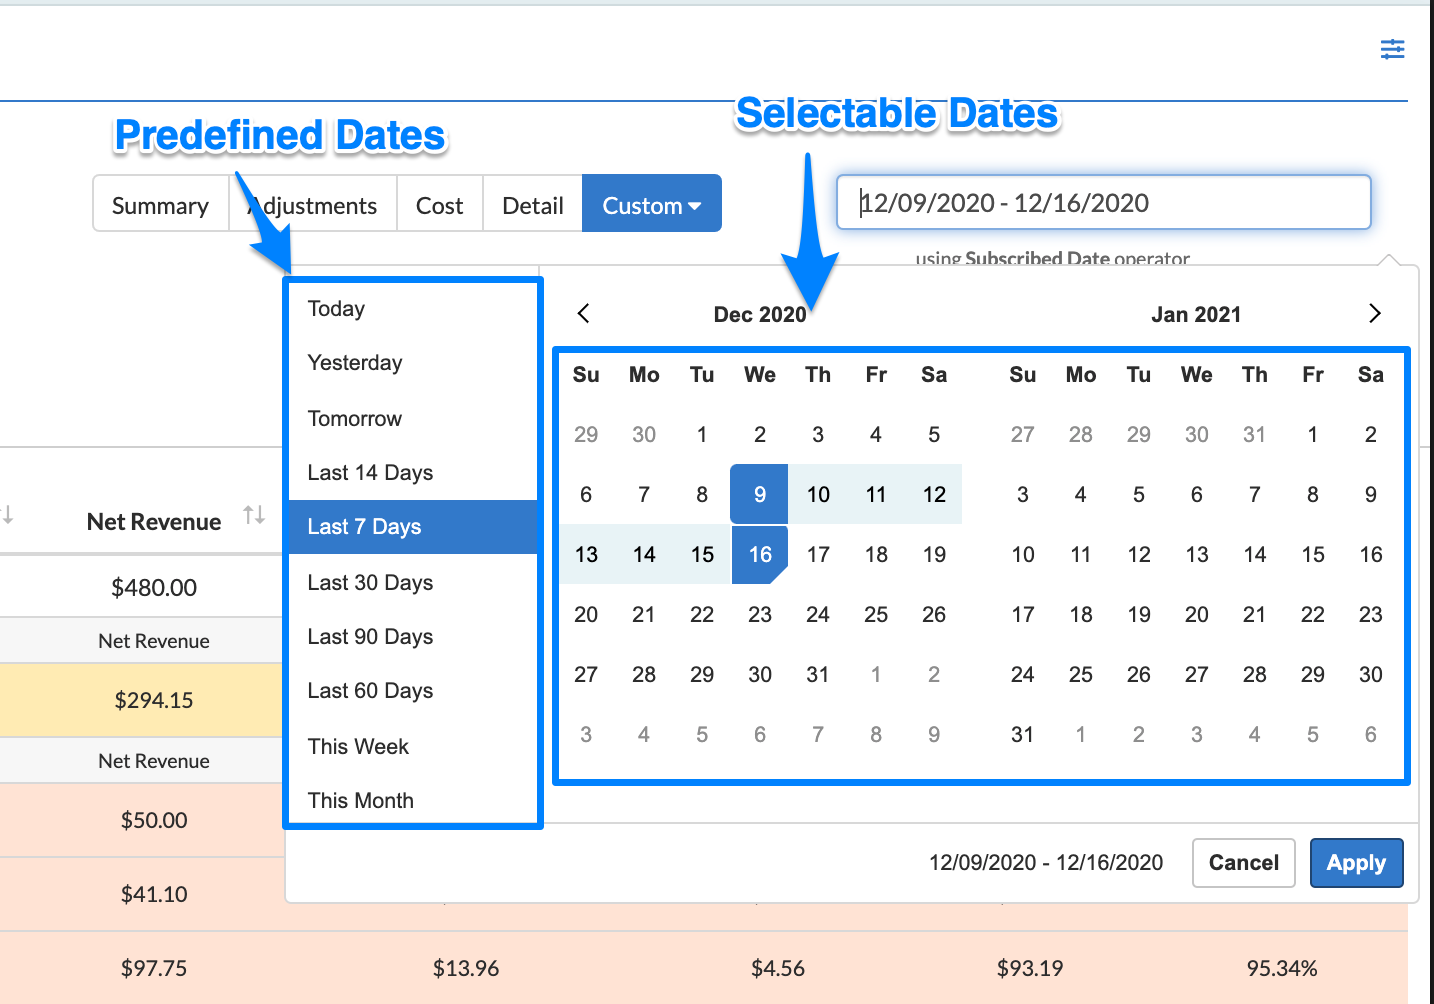
Custom Timeframes can be created for a unique grouping.
Use Case Example
I am testing a trial subscription that renews after 18 days to a 30 day subscription. I created a custom Timeframe to look at the acquisitions that occurred 18 days ago to monitor my renewal 1 rate.
Learn more about custom Timeframes here.
Automated Action Items
The overall goal of Sublytics is to be a tool used for data analytics on a high level or granular scale, but beyond that, it provides intelligent and automated action items derived from that data.
Once a report is customized based on the goals and needs of the business or program, there are my automated action items that can be setup within Sublytics.
- Export Data
- Create Reports and Alerts
- Create Dashboards
- Save Custom Reports
See more detail on automated reporting action items here.